The benefits of building and working with interactive simulations
Interactive simulations for better model intuition
About the author
Rasmus Kristoffer Pedersen
Ph.D.-student, Roskilde University, Denmark
Part of the Cancitis research group: http://dirac.ruc.dk/cancitis/
Introduction
Communicating scientific results remains a major challenge within any field, whether it is physics, medicine or mathematics. This is particularly the case for mathematical oncology, as mathematical results has to be disseminated clearly to medical collaborators. Understanding the significance of a particular mathematical result can be influential when clinical decisions are made. Mathematical results and predictions are however not the only things that benefit from improved communication. Developing mathematical models in collaboration with medical professionals or biologist can be a difficult and time-consuming task. In this blogpost, I will discuss a way to build intuition about a model and to get a feel for model behaviour, namely through the development of interactive simulations. Interactive simulations or visualizations are (in my definition) a class of model-implementations where a user can directly change and influence parts of the simulation. This could be parameters or initial conditions, but also more drastic changes like functional forms within the model. Of particular importance is that the user can make changes and see the resulting simulation after a short time, allowing for fast iterations and a possibility to play around with the implemented model. This is not only useful for someone trying to understand the model but also for the mathematician developing it, since model-intuition can drive further model development. There is a wide range of ways to make simulations of mathematical models interactive such as through Jupyter notebooks or MATLABs live editor. With increasing computational power, interaction and on-the-fly visualization is becoming more and more common-place: No matter your programming language of choice, there will be some way to add interactivity. Here I describe a somewhat different approach, where the model is implemented in JavaScript directly to be run by a web-browser. For this I use the library p5js, an open-source library developed for simple drawing within the browser, inspired by the visually-oriented language processing. Before going into the implementation and the pros and cons of using p5js and JavaScript versus another approach, we have to choose a model to implement.Model presentation
The model to be used here comes from the 2009 paper "Paradoxical Dependencies of Tumor Dormancy and Progression on Basic Cell Kinetics" by Enderling et al. The article defines the details of a cellular automata model of cancer growth on a grid. Cells occupy grid points and their behaviour at a given point in time depends on their current state and their neighbouring cells, see the figure below.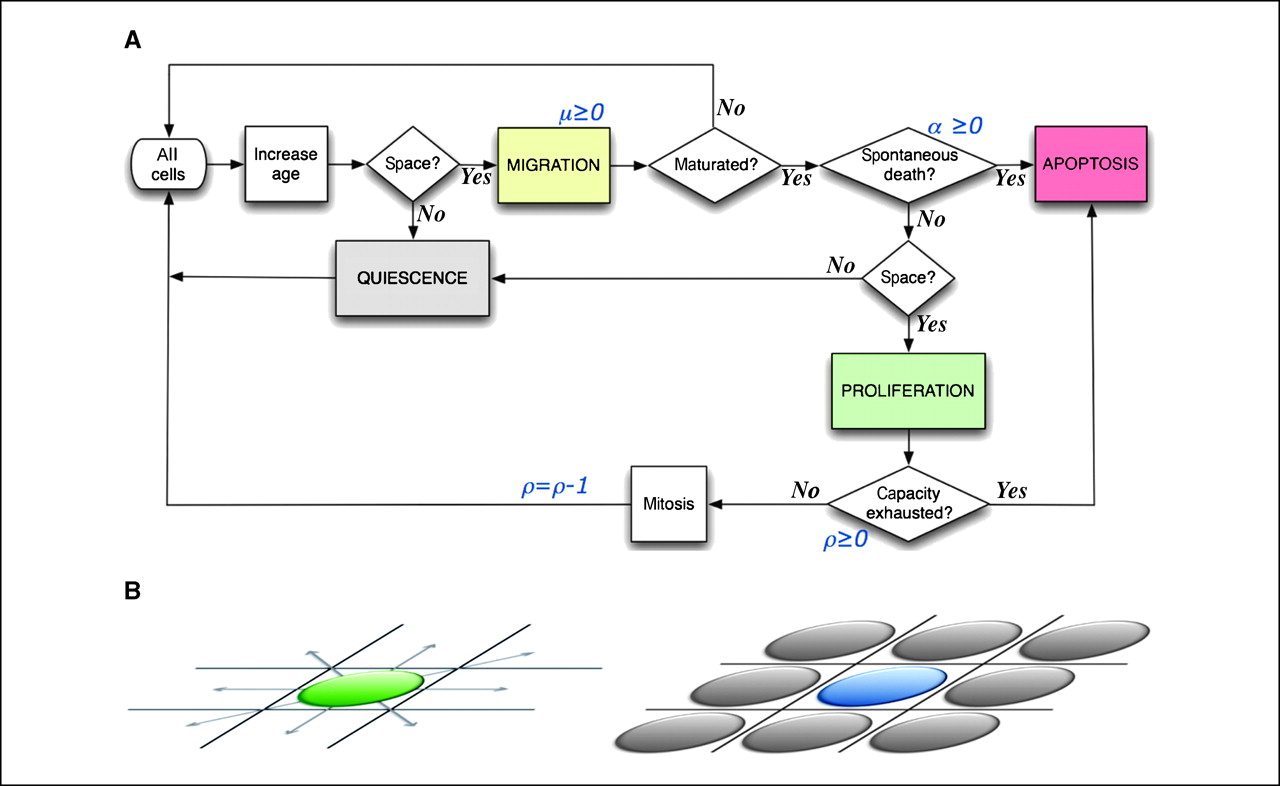 In simple terms, cells have a probability of dividing, a probability of moving and a probability of random cell death. Certain cells are considered stem cells and do not die. Stem cells we show in green. A given cell’s age decide whether it can divide into more cells. These immature cells are shown as white in the simulation below, while cells that are capable of division are shown in a light grey. When a cell has divided a given number of times, it dies. Dead cells are briefly flashed red before they are removed. If a cell is completely surrounded, it is considered quiescent and is colored dark grey. Note from the flowchart above that quiescent cell do mature, but they cannot perish due to random cell death.
When making interactive simulations, some restrictions of the implemented model can be necessary. Of all the parameters and choices that goes into the specifics of the model, the user only has the chance to experience the effect of changing some of them, so it is important to give great thought into exactly what the interaction should be. Some ideas for a model like the one considered here could be:
In simple terms, cells have a probability of dividing, a probability of moving and a probability of random cell death. Certain cells are considered stem cells and do not die. Stem cells we show in green. A given cell’s age decide whether it can divide into more cells. These immature cells are shown as white in the simulation below, while cells that are capable of division are shown in a light grey. When a cell has divided a given number of times, it dies. Dead cells are briefly flashed red before they are removed. If a cell is completely surrounded, it is considered quiescent and is colored dark grey. Note from the flowchart above that quiescent cell do mature, but they cannot perish due to random cell death.
When making interactive simulations, some restrictions of the implemented model can be necessary. Of all the parameters and choices that goes into the specifics of the model, the user only has the chance to experience the effect of changing some of them, so it is important to give great thought into exactly what the interaction should be. Some ideas for a model like the one considered here could be:
- Changing the initial conditions (e.g. position and number of stem cells)
- Modifying parameters (Either in real time or before a simulation)
- Switching between certain sets of parameters (e.g. treatment on/off)
- Direct interaction (e.g. clicking could force cell death or division in an area)
- Fundamental changes to model behaviour (e.g. activating death of quiescent cells)
- Extensions of model behaviour (e.g. adding “walls” that block cells)
The simulation
Specifics about the implementation
Although web-browsers can be sub-optimal for running efficient and fast simulations, implementing models in p5js and JavaScript has some benefits. One obvious benefit is the cross-compatibility of JavaScript. Any semi-modern device with a browser should be able to run the simulation above, be it a phone, an old laptop or even some TVs. A simple interactive simulation can be used for showing someone a mathematical model, right from their own device. If the simulation is put online (on a university web page or a personal site), anyone interested can play around with the model, on their own device, in their own time. Depending on the nature of the simulation, however, it might be worthwhile to consider if some interactivity is lost if the simulation is viewed from a phone or tablet and hence without a keyboard and mouse. Consider adding buttons instead of relying on keyboard presses. While simplifying a model for use in a visualization can be beneficial, one should be cautious. Be certain that the simplifications doesn’t change the general model behaviour and leads to inaccurate simulations. The intuition that the user gets about the mathematical model should be accurate, and too many simplifications could lead to users misinterpreting the model. Excessive simplification is of course a common pitfall in modelling, but when working on visualizations, it can be quite easy to make that mistake. Another benefit from building interactive simulations in JavaScript is that the source code is immediately readable to the user. Go ahead and go to /sketch.js and view the page source to see the code for the simulation above. Some of the strengths of the p5js framework is the relative simple structure of the code. In this example, the code is structured around a number of functions and a “Cell” object, defined at the bottom of the script. Each individual cell in the simulation is an instantiation of the cell object. Two of the functions defined in the script are special functions. These are the setup() and the draw() functions. When the page has loaded, the setup() runs once. Following this, the draw() will run continuously, with each run-through counted as a frame in a variable frameCount. Note that everything in p5js is drawn “on top” of what is previously displayed. For this reason, every frame (i.e. every draw() loop) should start with drawing a clear background, using the background() command. The setup function and the continuously repeated draw function allows for a clear structure in which every step of a simulation can be included in the draw loop and subsequently be drawn. While most of the code for the simulation above has been commented in detail, I refer to the p5js reference if you want to know more about the specifics of the framework.Final comments
Implementing mathematical models in an interactive environment can be a time-consuming task, but having an easy way of interacting with a mathematical model can be incredibly useful and in some cases actually quite fun. Apart from being a way to disseminate the behaviour of a model, it also provides a fantastic tool for general outreach and advertisement toward future students. From my own personal experience, a small interactive simulation I developed three years ago is still being actively used for recruiting future bachelor-program students. Even though playing around with an interactive simulation does not lead to the same deep understanding about a model as going through the mathematical analysis of it, the intuition granted can be useful for anyone, mathematicians and non-mathematicians alike. New ideas for a model could arise even for someone having worked with the model for a long time. I find that seeing a model in a new light and getting a feel for it, can be useful for understanding a model. In addition, letting non-experts interact with a model could lead to enhanced interest, or perhaps also new ideas for model development. In a field where we have to work toward a common understanding of both mathematics and oncology, interactive visualizations could be one way to share mathematical insights and to help clinicians have an intuitive understanding of what mathematical modelling actually is.References
1. Paradoxical Dependencies of Tumor Dormancy and Progression on Basic Cell Kinetics. Heiko Enderling, Alexander R.A. Anderson, Mark A.J. Chaplain, Afshin Beheshti, Lynn Hlatky and Philip Hahnfeldt. Cancer Res November 15 2009 (69) (22) 8814-8821; DOI: 10.1158/0008-5472.CAN-09-2115© 2026 - The Mathematical Oncology Blog