Three facts you did not know about publishing in Mathematical Oncology
Behind the paper
75 years of mathematical oncology
Franco Pradelli, Maximilian Strobl, Sadegh Marzban, François de Kermenguy, Ari Barnett, Katyayni Ganesan, Guillermo Lorenzo, David A. Hormuth II, Sara Hamis, Dhananjay Bhaskar, Alexander R. A. Anderson, Jeffrey West
Read the preprintFact 1: Sharing your work increases your citations
Open Access (OA) remains a controversial topic in science, particularly when associated with high article processing charges (APCs). As a result, many researchers question whether Open Access publishing is truly worth the cost. In Mathematical Oncology, our data show that Open Access does increase citation counts—but that freely sharing your work does even more. While all forms of OA are associated with higher citations, Green Open Access (i.e., making a manuscript available through a preprint repository) stands out providing the highest citations per year on average (Fig. 1f). In practical terms, if you are not already sharing your work on platforms such as arXiv, bioRxiv, or medRxiv, the evidence suggests it may be time to reconsider.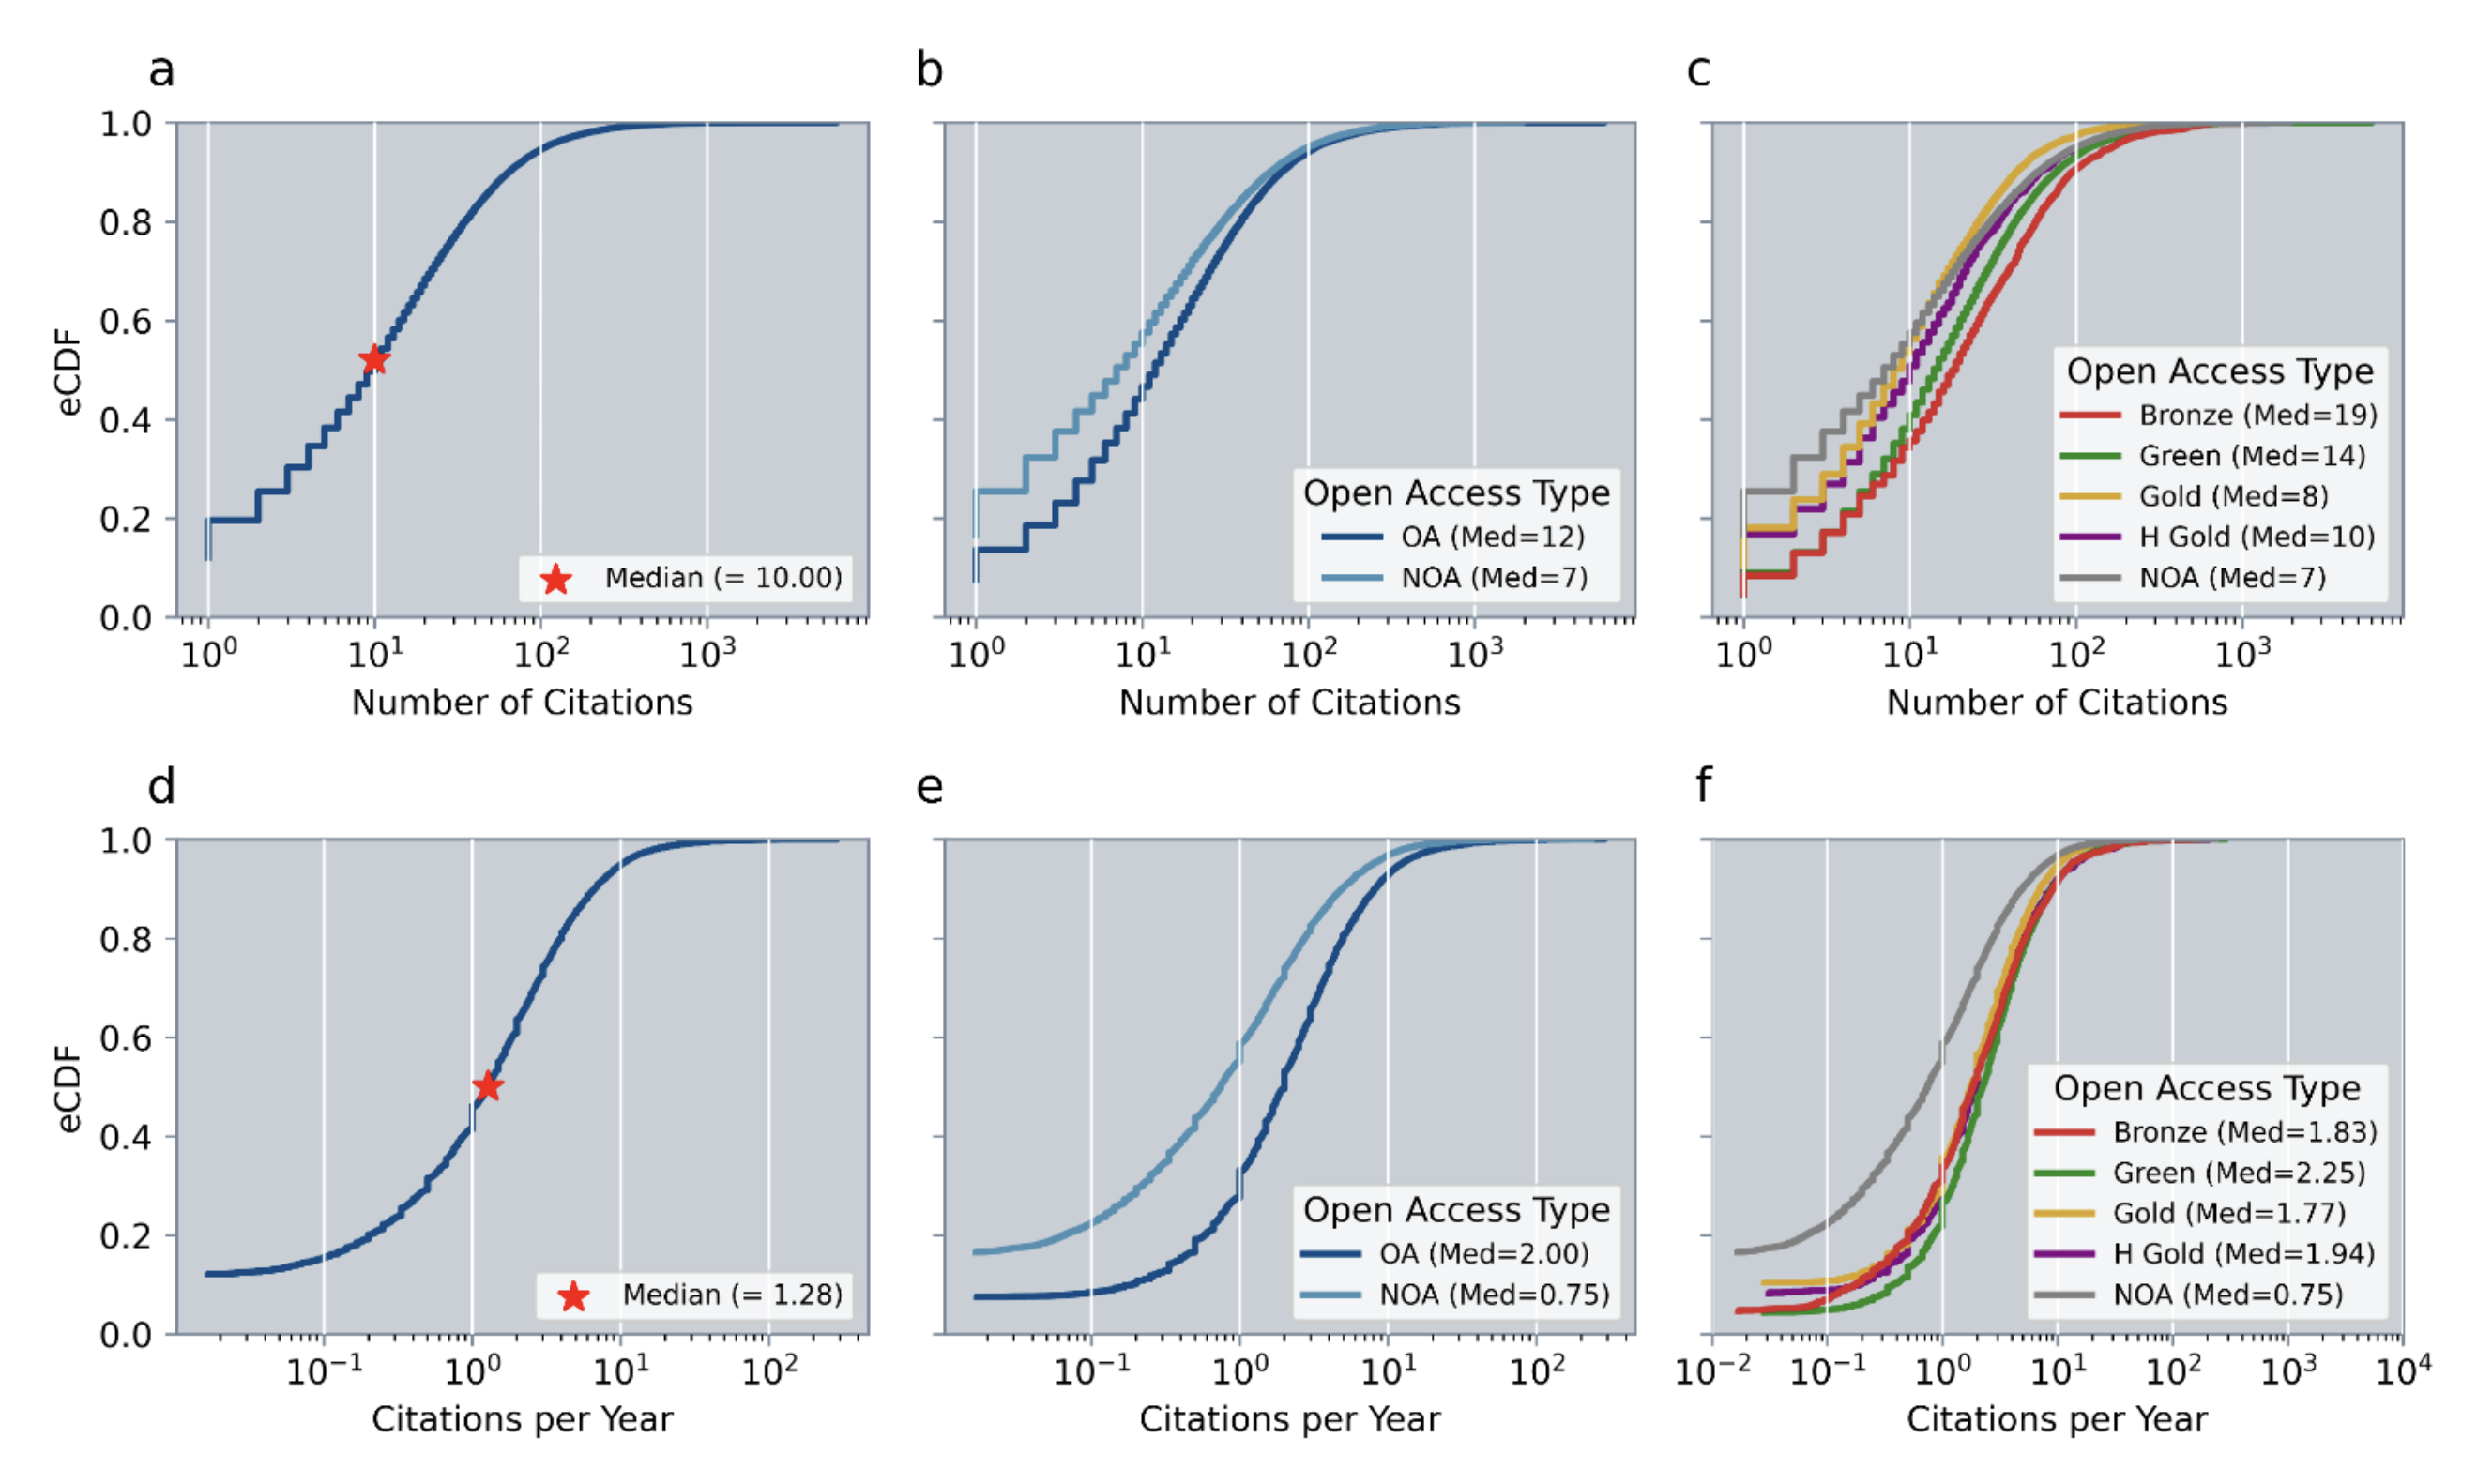
Fact 2: Journal of the Royal Society Interface truly sits at the interface
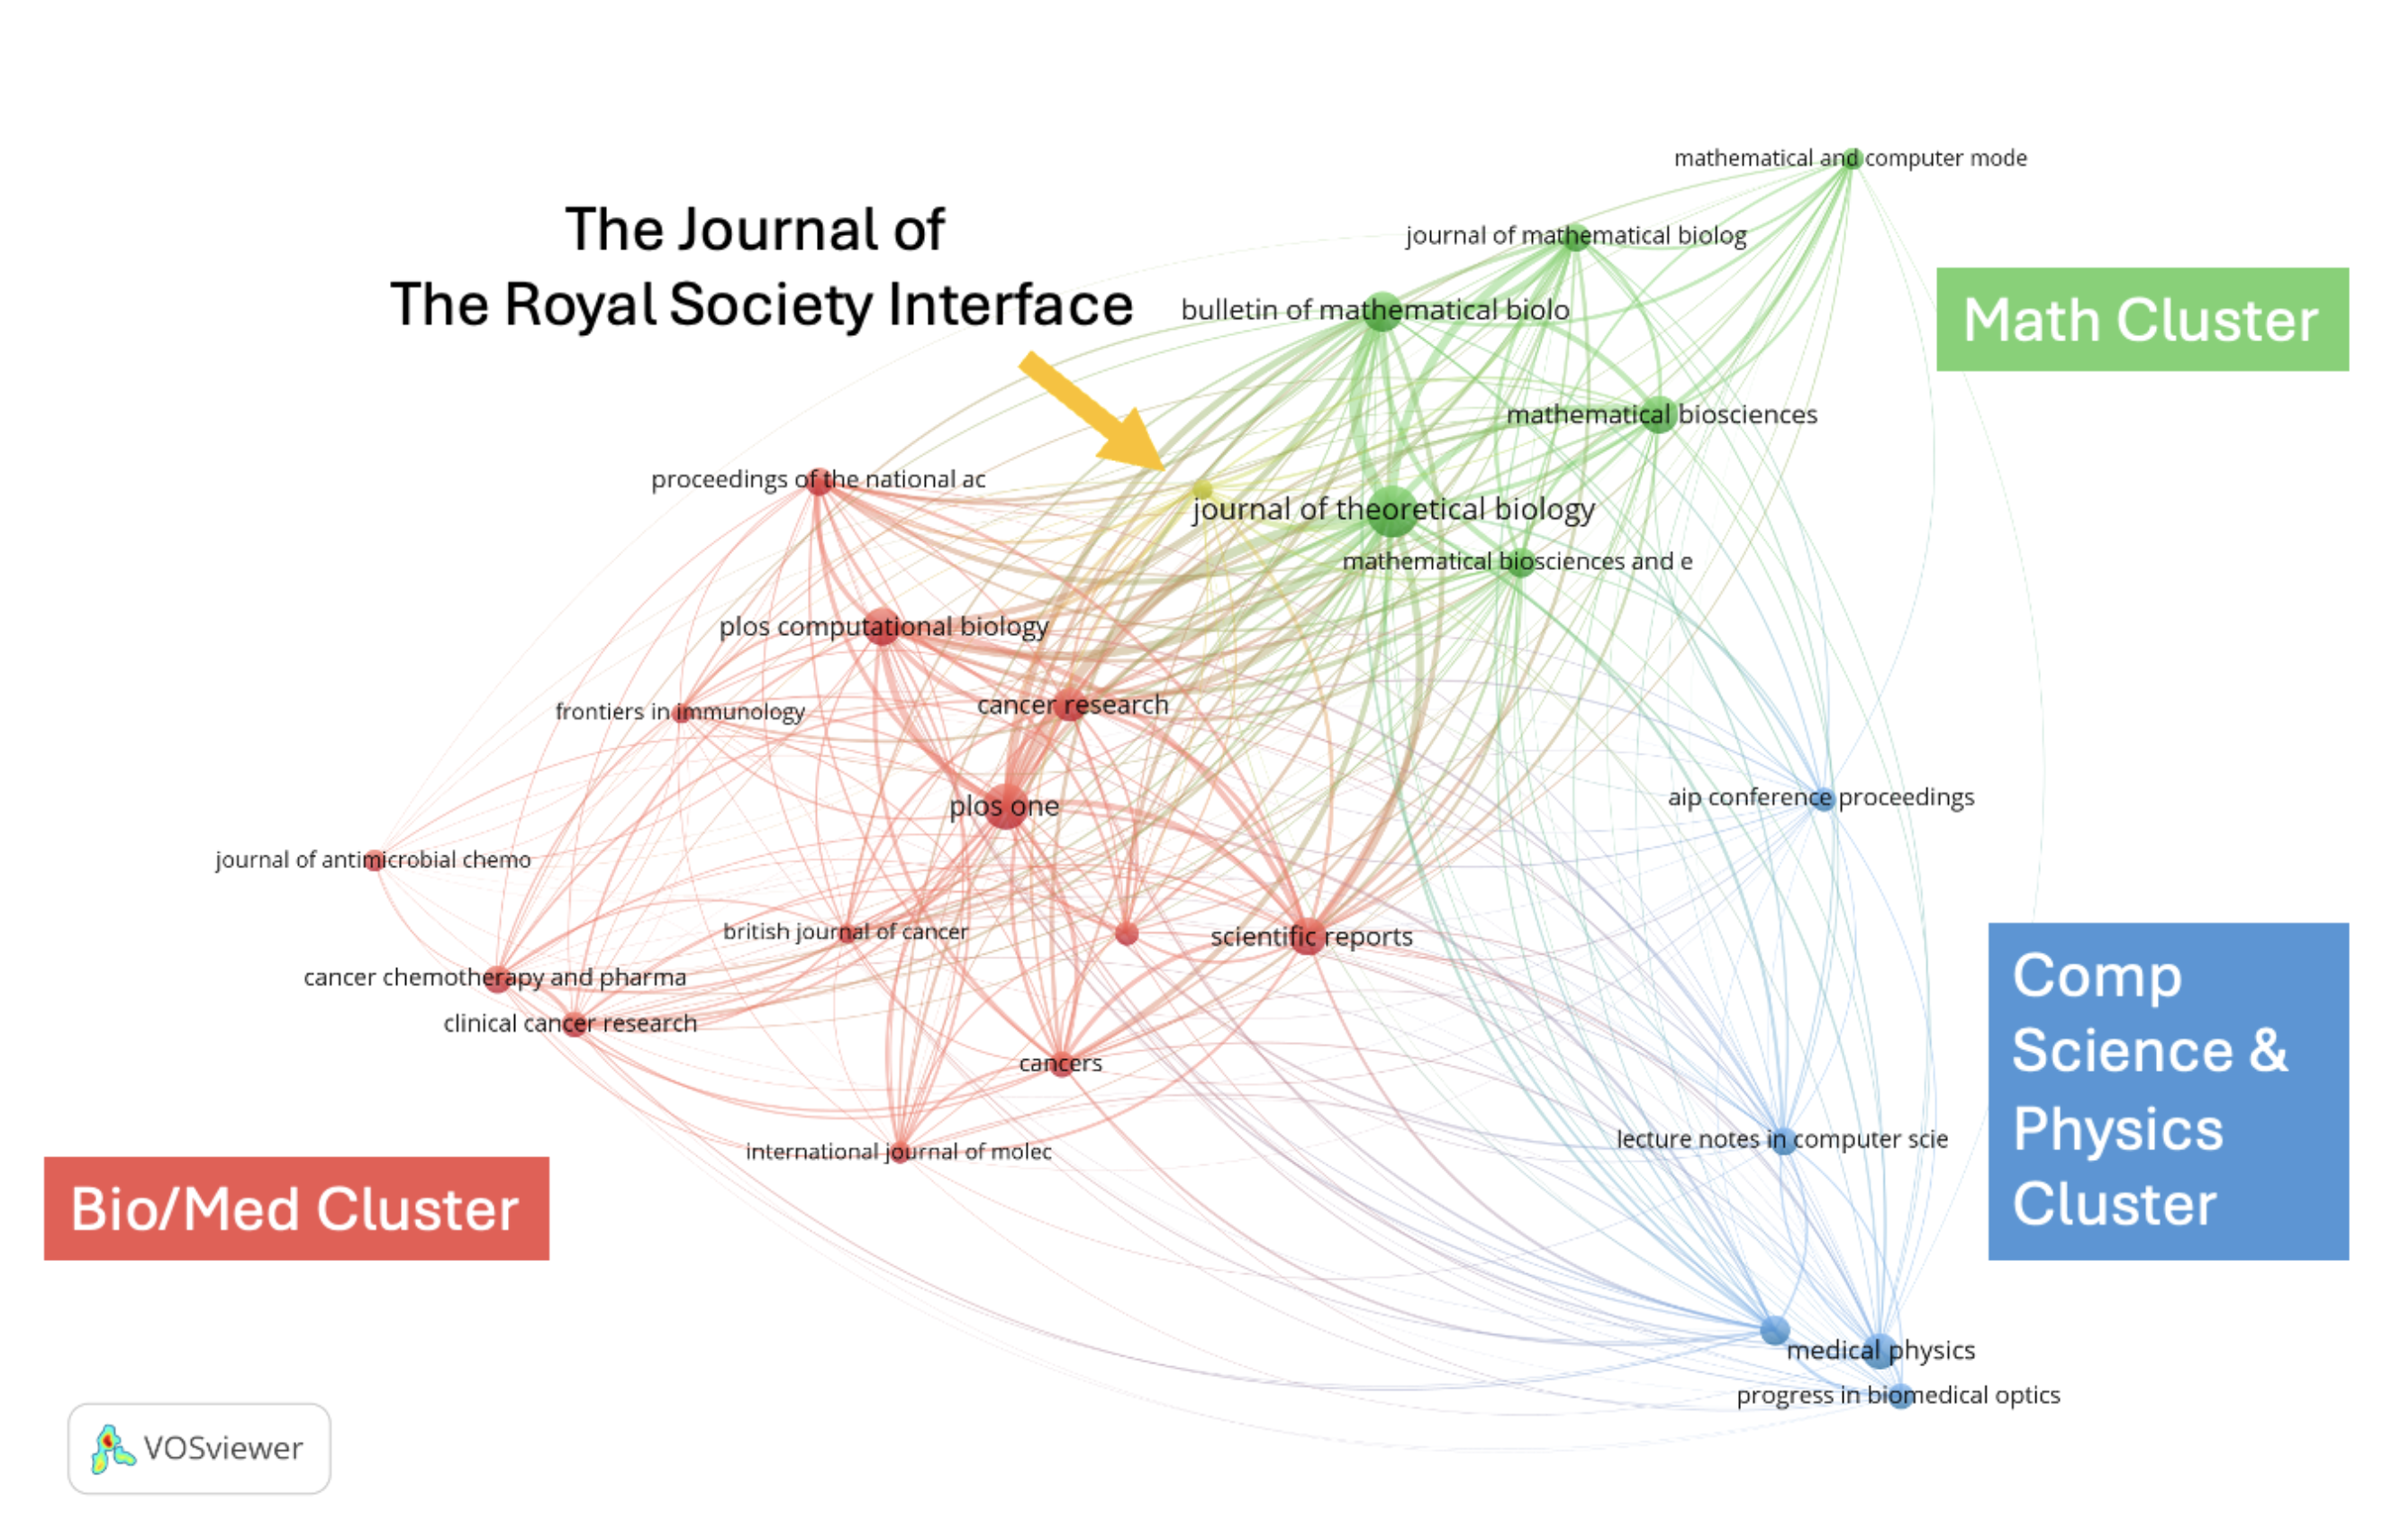
This one genuinely surprised us. One of the core tools in bibliometrics is bibliographic coupling: constructing networks in which journals (or authors) are grouped according to shared citation patterns. Applying this approach allowed us to produce one of our favorite figures in 75 Years of Mathematical Oncology (Figure 5 of the manuscript), mapping the intellectual structure of the field. When we performed the same analysis at the journal level, a striking pattern emerged. Medical and biological journals clustered tightly together; mathematical and computational journals formed a separate group. And sitting squarely between them was the Journal of the Royal Society Interface. Given that the description of the journal reads:“J. R. Soc. Interface welcomes articles of high quality research at the interface of the physical and life sciences”This positioning in our network suggests remarkable success. Few journals so literally occupy the conceptual space their title implies.
Fact 3: Interdisciplinarity has always been intrinsic to the field
That Mathematical Oncology is interdisciplinary is hardly controversial. What is surprising is how deeply this interdisciplinarity is embedded in the field’s history. By examining journals that published mathematical oncology research over the past 75 years, we found that papers have consistently appeared in mathematical, biological, and medical journals in roughly equal proportions—from the earliest decades to the present day. This balance is not a recent development driven by modern funding priorities or translational rhetoric; it is a defining feature of the discipline. Mathematical Oncology has always positioned itself at the crossroads of fields, integrating quantitative tools with biological and clinical insight. Its translational character is not an aspiration—it is a historical reality.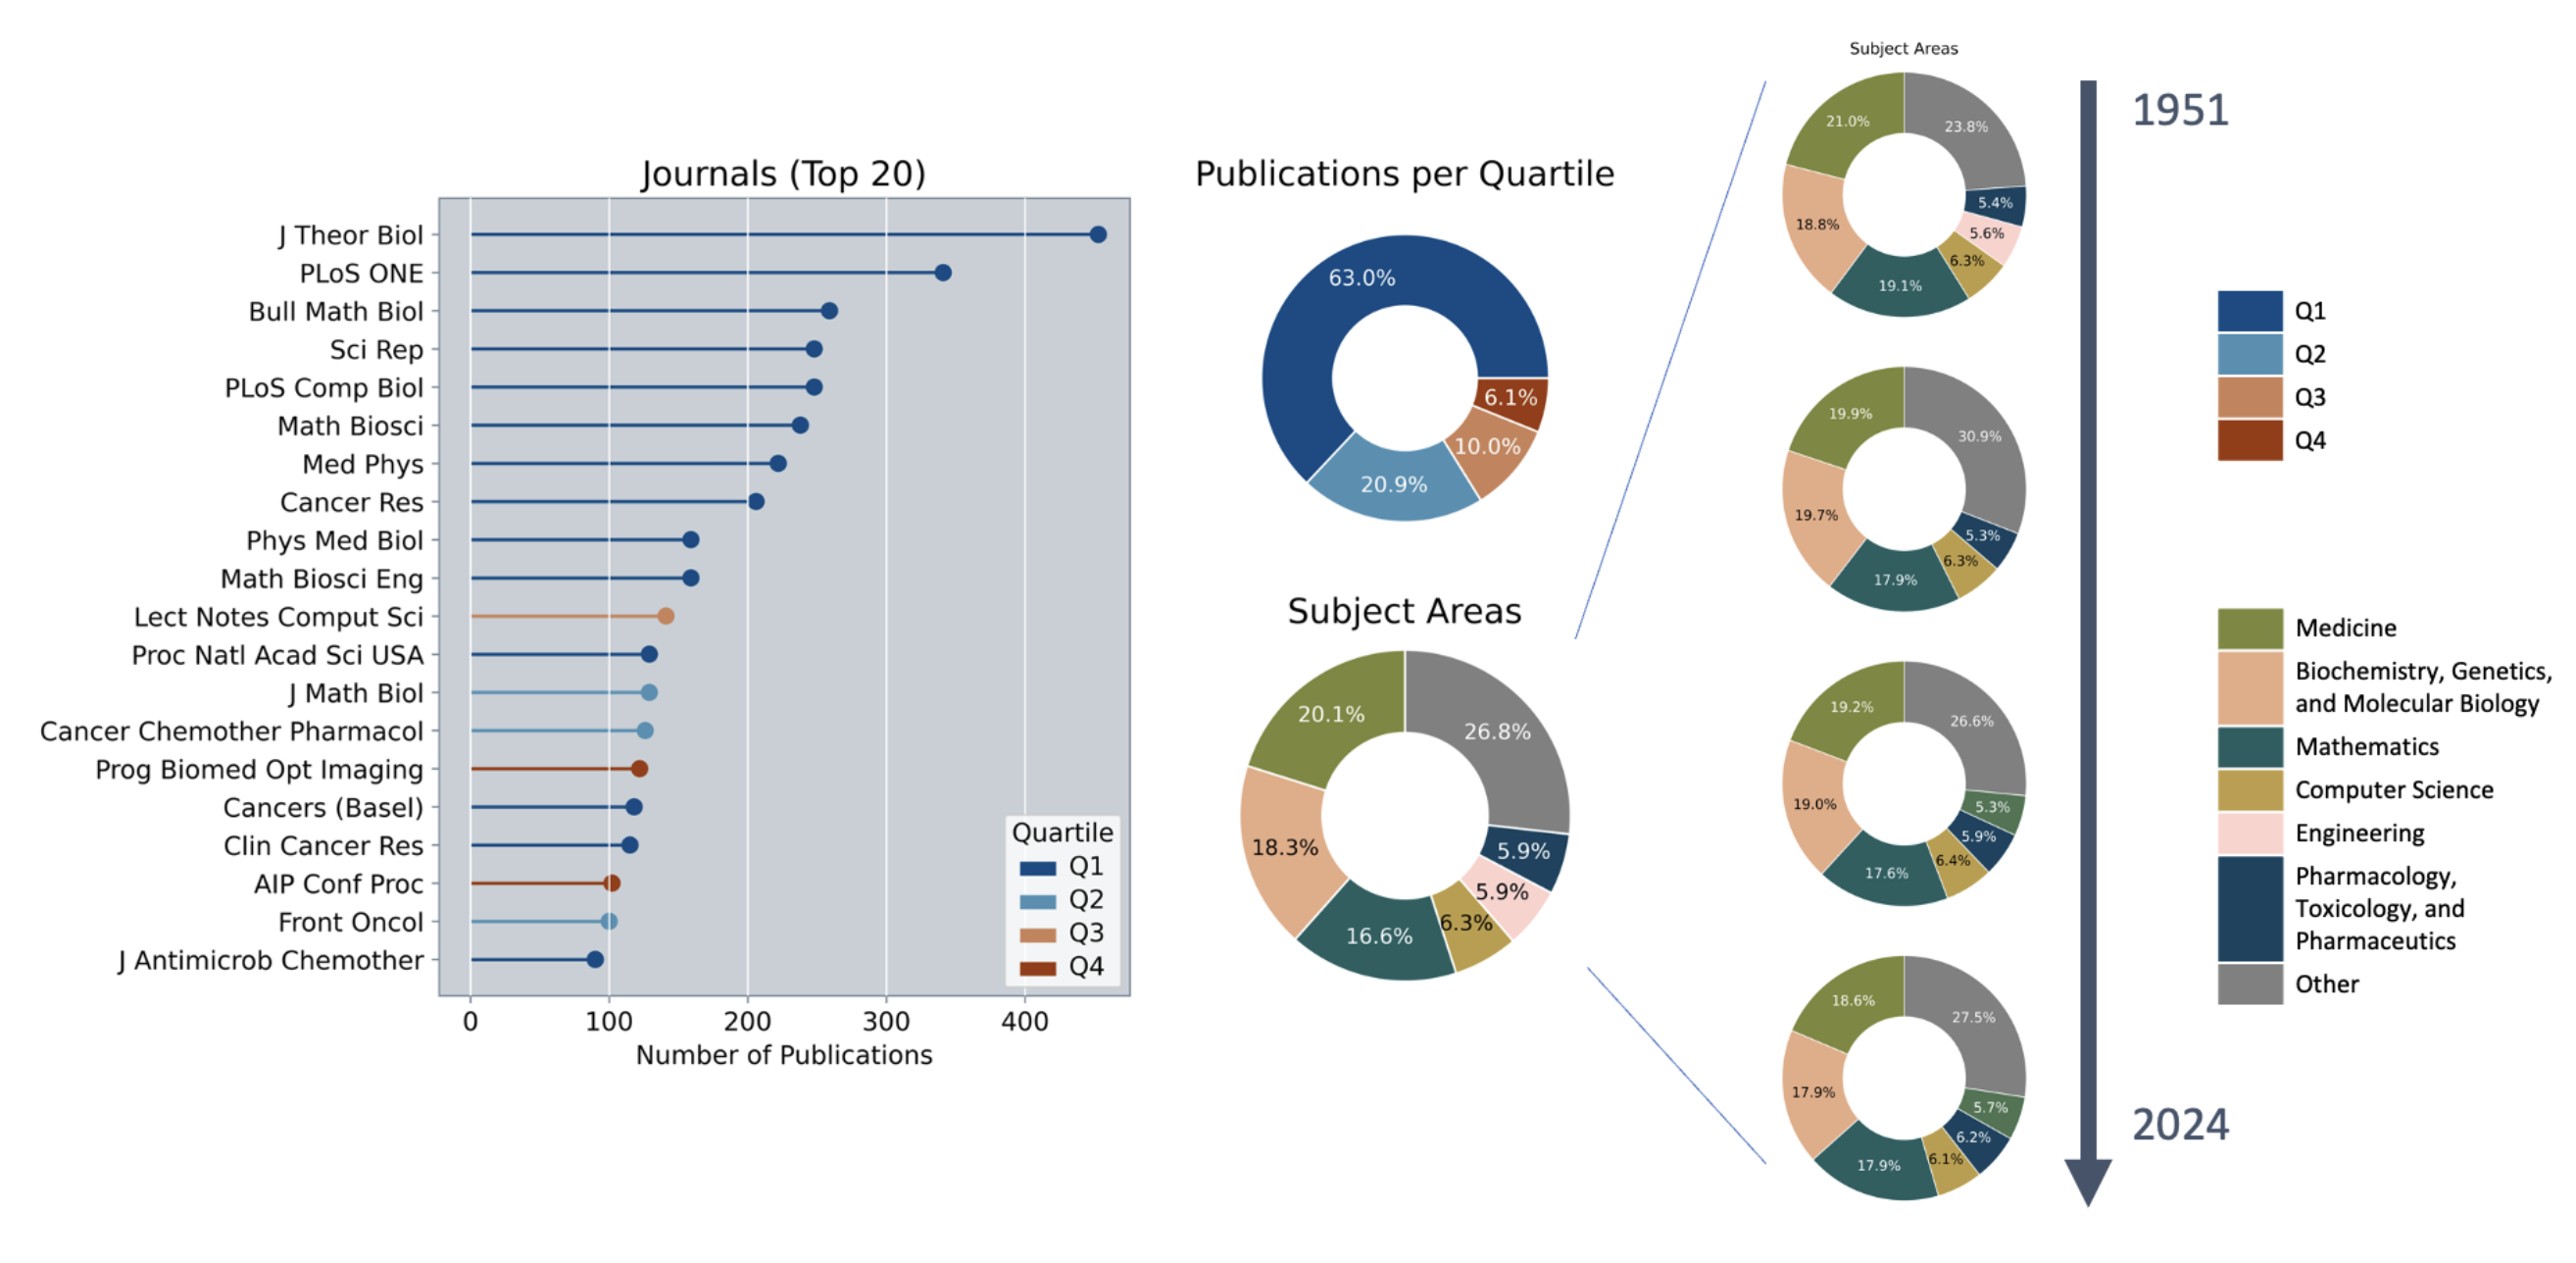
© 2026 - The Mathematical Oncology Blog