
Click the image below to view the full size version of this
cover.
Created by: Jonah J Klowss, Ryan J Murphy & Matthew J Simpson
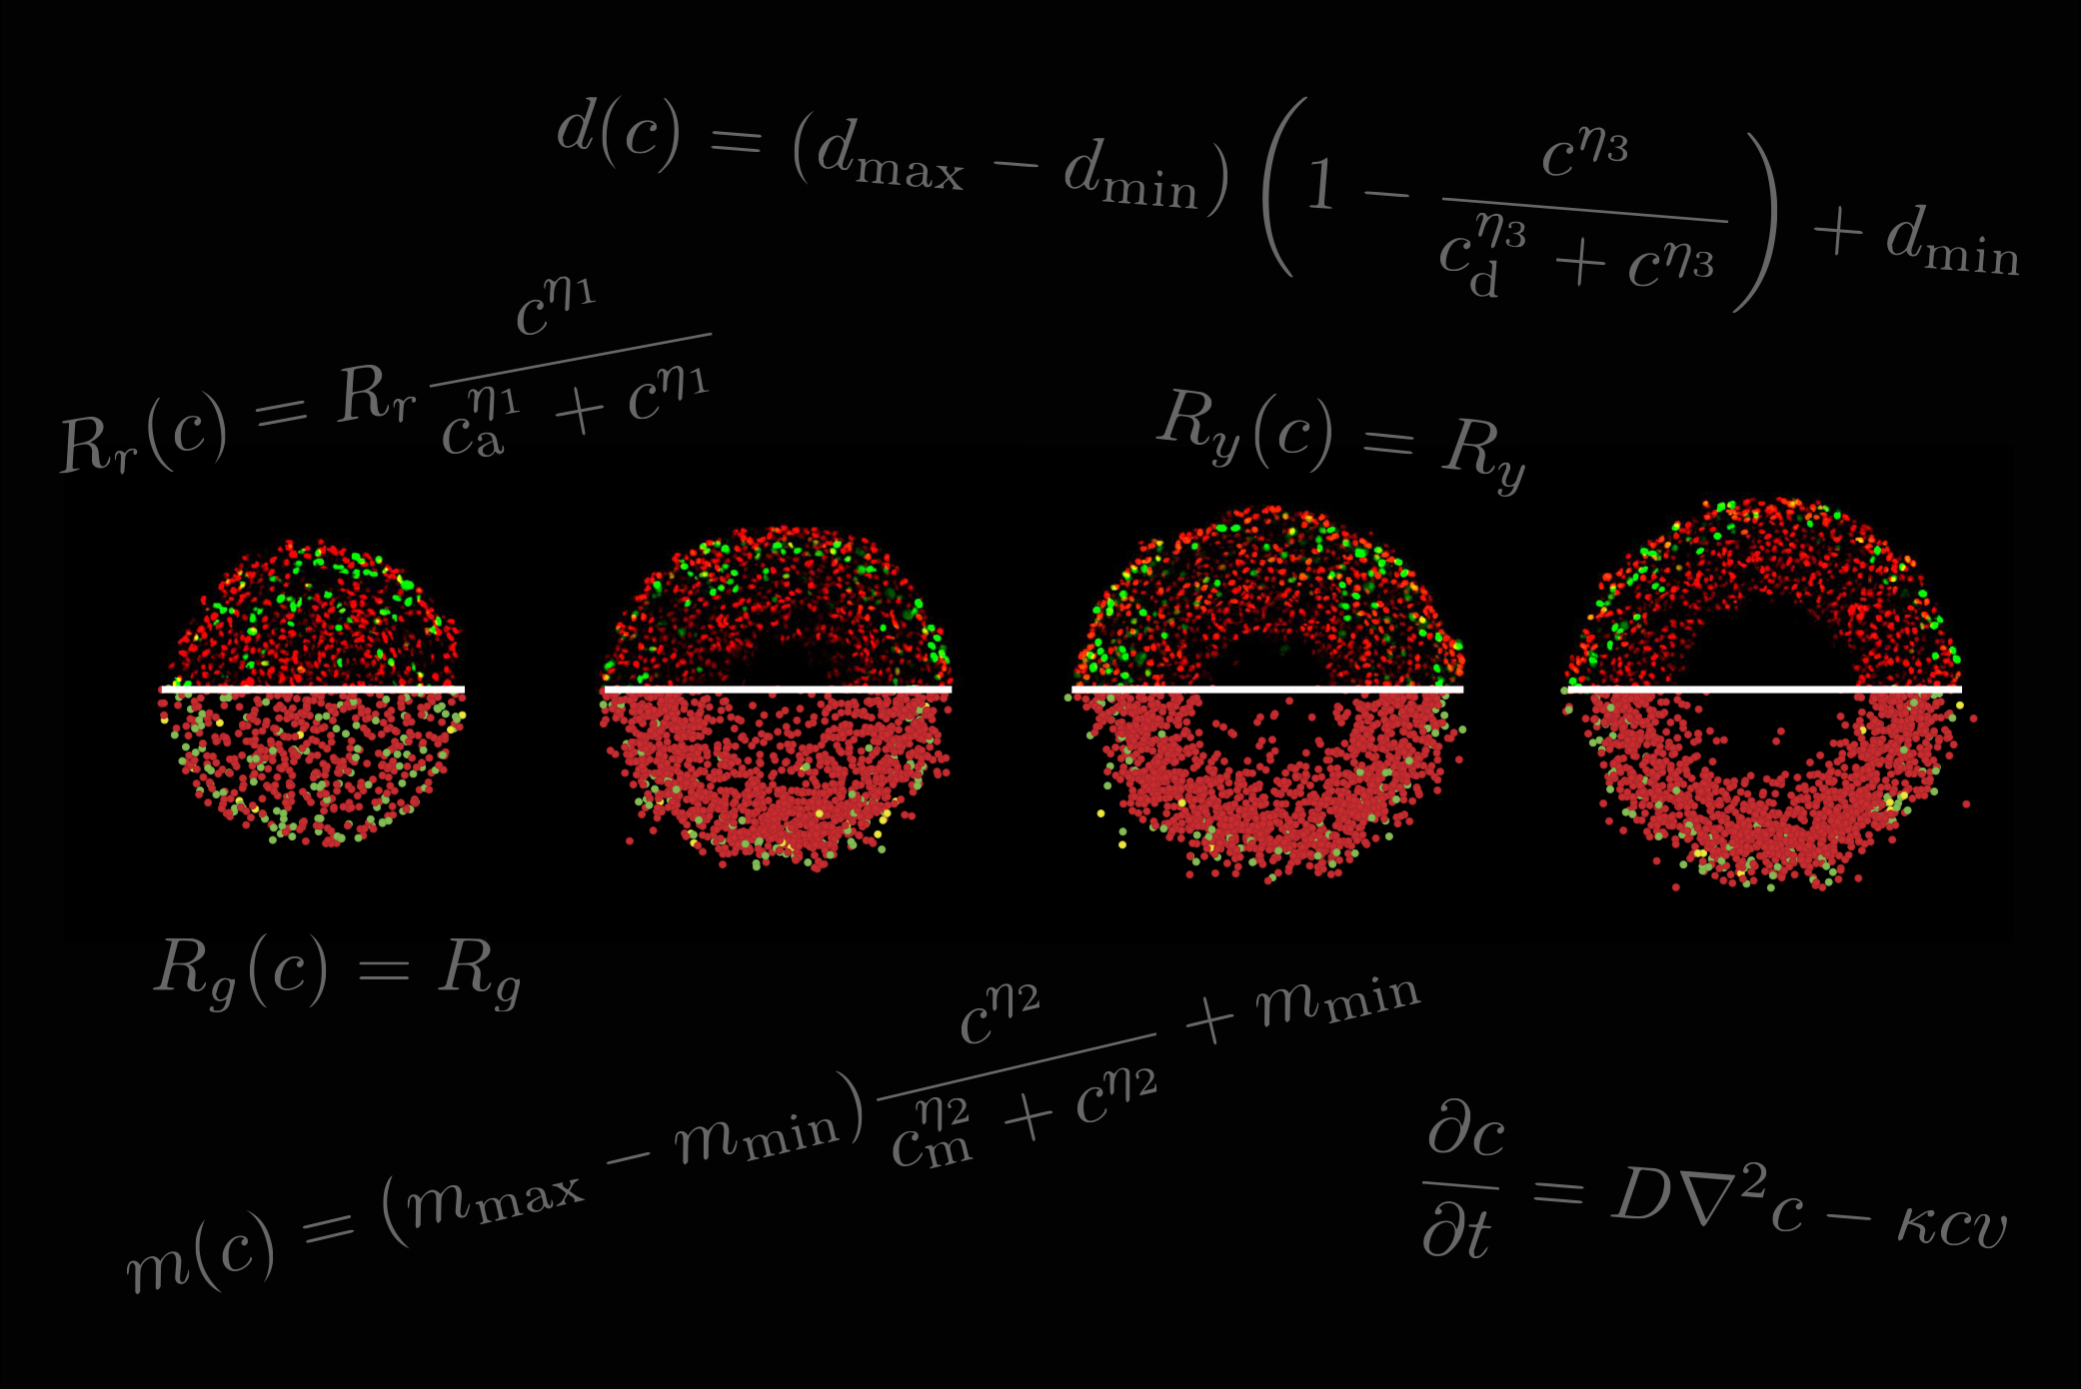
Issue 209: This artwork shows the growth of spheroids at four timepoints, representing work from our recently published paper in the Journal of the Royal Society Interface. Each spheroid image is composed of two halves: in vitro experimental images (upper half above white line); and simulations of our new individual-based model (lower half below white line). Colours in the images represent cell-cycle status, with G1 phase (red), eS phase (yellow), and S/G2/M phase (green). Images at later times show spheroids with an outer proliferative region, an intermediate region dominated by G1-arrested cells, and a necrotic core. In our work, we take advantage of real-time fluorescent cell cycle imaging to identify the cycling status and position of individual cells to develop the first stochastic individual-based model (IBM) of a 4D tumour spheroid. Our study shows that simulations of our IBM are consistent with experimental data for a human melanoma cell line. The IBM also allows us to extract quantitative information that is difficult to estimate experimentally, such as nutrient availability within the spheroid.
© 2026 - The Mathematical Oncology Blog