How to use transcriptomic data for game-theoretic modeling of treatment-induced resistance in cancer cells?
A case study in patient-derived glioblastoma organoids
How to use transcriptomic data for game-theoretic modeling of treatment-induced resistance in cancer cells? A case study in patient-derived glioblastoma organoids
Weronika Gąska, Christer Lohk, Maikel Verduin, Christopher Hubert, Marc Vooijs, Rachel Cavill, Kateřina Staňková
Read the preprint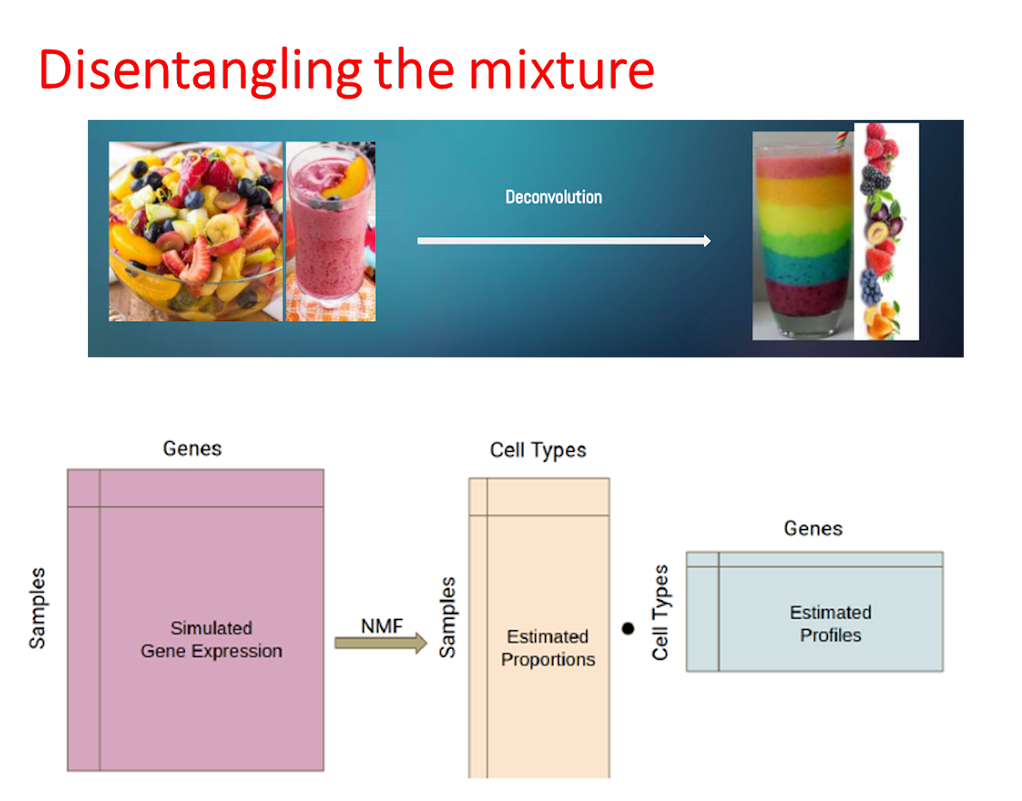 We have a series of smoothies mixed with different, yet unknown fruits. And the question is whether we can figure out how many fruits are in, what their characteristics are, and what the proportion of each fruit is in each smoothie. Now here, the smoothie is the organoid - each organoid contains different cell types which have different characteristics (like the different fruit), and each organoid has different proportions of these different cell types.
Furthermore, our smoothie is changing composition over time, in response to the treatment. At this point we had a choice, we could go into it completely blind, using unsupervised methods, meaning that we do not presuppose what types of fruits there are, nor what each fruit looks like ahead of our analysis in an unsupervised deconvolution. Or we could take from a selection of fruits we might expect to see in our smoothies and use these profiles to define the fruits we were looking for, in a supervised deconvolution.
Back to our bulk data from organoids. We applied both the supervised and the unsupervised deconvolution methods to identify different cell types in the organoids. In the supervised case we used public single cell data, to give us profiles of the cell types we would expect to see in the tumors. And then we tracked how the proportions of these cell types changed over time. In the case of unsupervised method, we first used the TCGA (The Cancer Genome Atlas) dataset to identify cell types, as this was a much larger dataset than our organoids. In this case nothing is assumed about the proportions nor the profiles of the cell types in advance of the analysis.
For the unsupervised methods we ran into issues surrounding the different types of cells that are present in real patient, compared to those present in the organoids. This meant that several of the cell types we identified from the patient data, couldn’t really be detected in the organoids (the algorithm gave them a low proportion in every sample). After looking at the genes which characterized these types, we could see they were probably things such as immune cells which we wouldn’t expect to see in the organoids.
We have a series of smoothies mixed with different, yet unknown fruits. And the question is whether we can figure out how many fruits are in, what their characteristics are, and what the proportion of each fruit is in each smoothie. Now here, the smoothie is the organoid - each organoid contains different cell types which have different characteristics (like the different fruit), and each organoid has different proportions of these different cell types.
Furthermore, our smoothie is changing composition over time, in response to the treatment. At this point we had a choice, we could go into it completely blind, using unsupervised methods, meaning that we do not presuppose what types of fruits there are, nor what each fruit looks like ahead of our analysis in an unsupervised deconvolution. Or we could take from a selection of fruits we might expect to see in our smoothies and use these profiles to define the fruits we were looking for, in a supervised deconvolution.
Back to our bulk data from organoids. We applied both the supervised and the unsupervised deconvolution methods to identify different cell types in the organoids. In the supervised case we used public single cell data, to give us profiles of the cell types we would expect to see in the tumors. And then we tracked how the proportions of these cell types changed over time. In the case of unsupervised method, we first used the TCGA (The Cancer Genome Atlas) dataset to identify cell types, as this was a much larger dataset than our organoids. In this case nothing is assumed about the proportions nor the profiles of the cell types in advance of the analysis.
For the unsupervised methods we ran into issues surrounding the different types of cells that are present in real patient, compared to those present in the organoids. This meant that several of the cell types we identified from the patient data, couldn’t really be detected in the organoids (the algorithm gave them a low proportion in every sample). After looking at the genes which characterized these types, we could see they were probably things such as immune cells which we wouldn’t expect to see in the organoids.
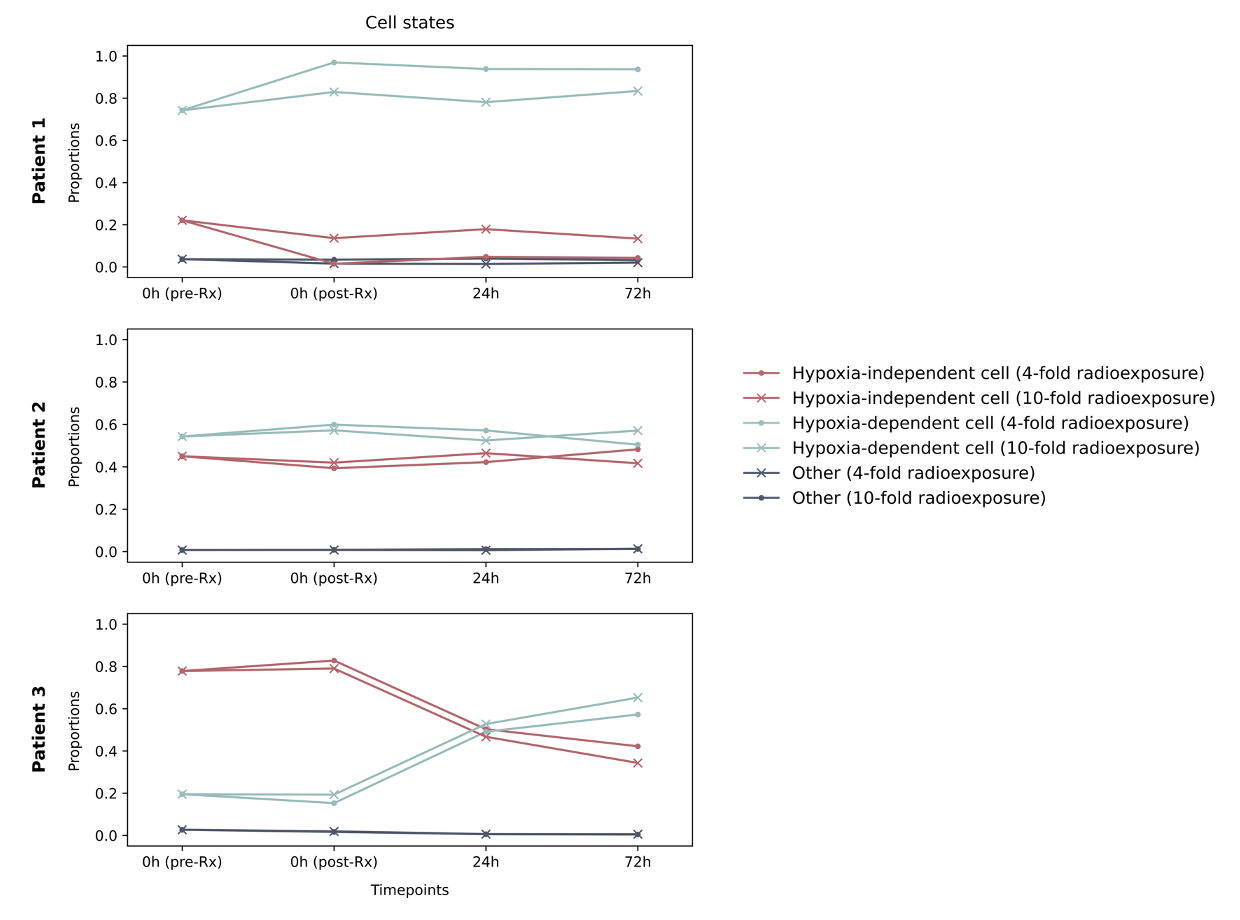
Figure 1: Population dynamics of mesenchymal-like and cycling cells in patient-derived glioma organoids under two divergent conditions. Hypoxia-independent cells are MES-like 1 and Hypoxia-depedent cells are MES-like 2 in Neftel’s scheme
We had more luck with the supervised analysis. Using single cell data from other publications, especially2, we were able to make artificial mixtures in silico, with known proportions of each cell type, and then train a neural network to predict the proportions from the data. Using this neural network on the real data we could see how the proportions of cycling cancer cells changed in response to treatment (Fig. 1). More than 96% of all organoids (at all timepoints) appear to consist of mesenchymal-like cells while the remaining 4% (or less) belong to other cell types, which have constantly low proportions. So we focused on just modeling the mesenchymal-like cells.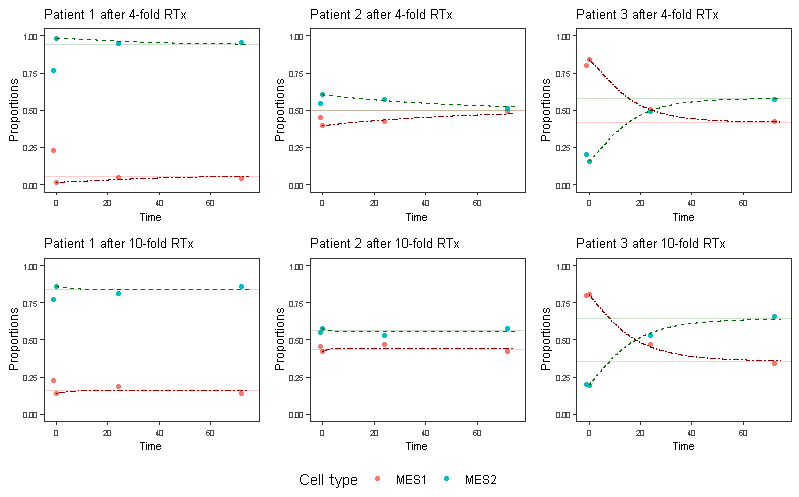
Figure 2: Fitted replicator dynamics equations vs. the measurements and ESS (horizontal line). First point (not fitted) indicates the measurement before the therapy is applied.
We fit the obtained proportions to replicator equations model (Fig. 2). One could say: “Mission accomplished”, but many questions remain, such as these ones:- Can we validate that these predictions are correct through more time series data?
- Does irradiation lead to stabilization of the proportion of different cell types in all patients?
- What is data that we can use for our game-theoretic models better?
- Can we combine the estimated proportions through organoids with volumetric measurements in real patients (similarly to 3 and 4), to fit and validate models of eco-evolutionary dynamics?
References
- Gąska, W. et al (2022) How to use transcriptomic data for game-theoretic modeling of treatment-induced resistance in cancer cells? A case study in patient-derived glioblastoma organoids? bioRxiv 2022.01.26.477755. https://doi.org/10.1101/2022.01.26.477755
- Neftel, C. et al. (2019) An Integrative Model of Cellular States, Plasticity, and Genetics for Glioblastoma. Cell, 178(4), 835–849.e21. https://doi.org/10.1016/j.cell.2019.06.024
- Ghaffari Laleh, N. et al. (2022) Classical mathematical models for prediction of response to chemotherapy and immunotherapy. PLoS Comput Biol 18(2): e1009822. https://doi.org/10.1371/journal.pcbi.1009822
- Martinez, V.A. et al. (2022) Improving mathematical models of cancer by including resistance to therapy: a study in non-small cell lung cancer. bioRxiv 2021.10.29.466444. https://doi.org/10.1101/2021.10.29.466444
- Hubert, C. G et al. (2016). A Three-Dimensional Organoid Culture System Derived from Human Glioblastomas Recapitulates the Hypoxic Gradients and Cancer Stem Cell Heterogeneity of Tumors Found In Vivo. Cancer research, 76(8), 2465–2477. https://doi.org/10.1158/0008-5472.CAN-15-2402
© 2026 - The Mathematical Oncology Blog