Navigating Tumor Evolution: Tracing Tumor Clones' Travel in Space with LinG3D
Behind the Paper
LinG3D: visualizing the spatio-temporal dynamics of clonal evolution
Anjun Hu, Awino Maureiq E. Ojwang’, Kayode D. Olumoyin, Katarzyna A. Rejniak
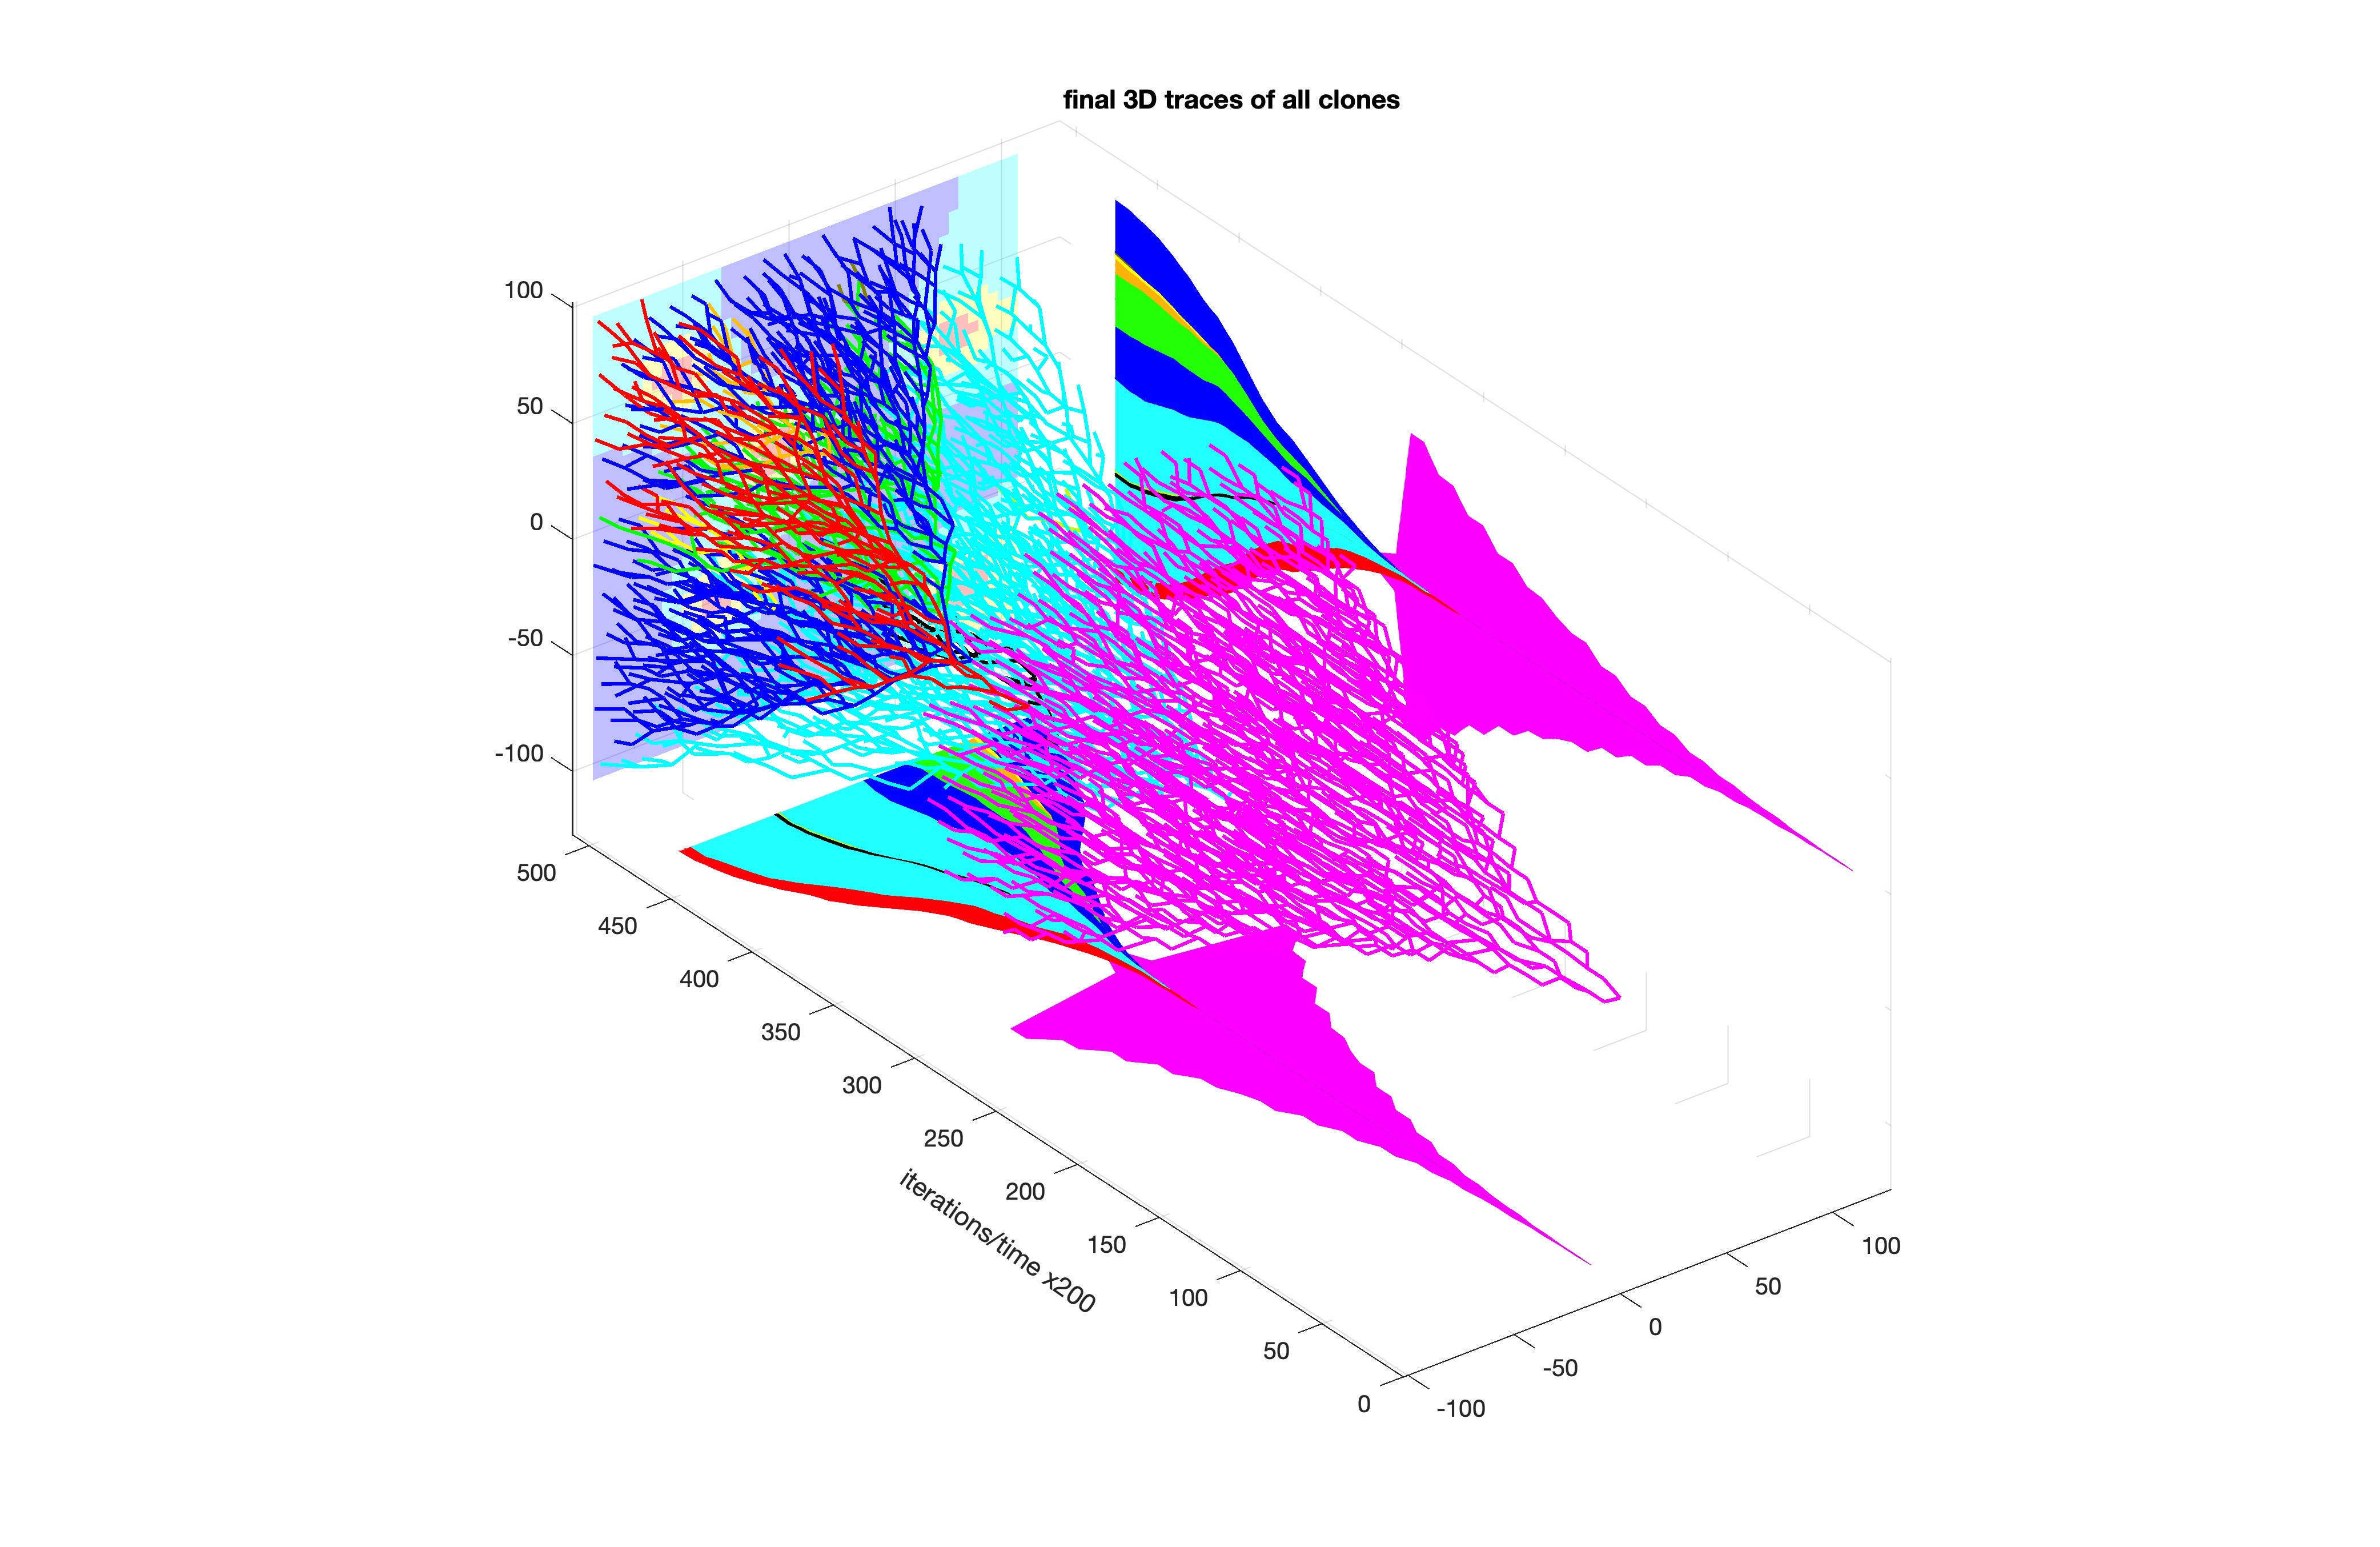
Read the paperPicture that you can track the evolution of tumor clones, unveil their spatial intricacies within the tissue, and see their development over time. Our tool, the Lineage Graphs in 3D (LinG3D), does just that. While traditional lineage trees depict cellular mother-daughter relationships over time, LinG3D adds a spatial dimension by mapping the positions of individual cellular clones within the tumor tissue patch [1]. It's like having a personalized GPS guiding us through space and time from a mother cell toward all its successor cells. This novel approach to visualizing simulated tumors can give researchers a deeper understanding of how the tumor microenvironment shapes clonal evolution (Figure 1).
In cancer treatment, efficacy hinges on precisely targeting malignant cellular clones and understanding how these tumor clones adapt in response to therapies. However, traditional models of cancer evolution often overlook a critical factor: the spatial dynamics within the tumor microenvironment. This gap in understanding spurred the development of LinG3D, an innovative toolkit designed to shed light on the complex interplay between time and space in tumor evolution.
However, LinG3D isn't just limited to visualizing simulated tumor development—it can also help assess the effects of therapeutic compounds on tumor growth and resistance. Tumors are notorious for their ability to adapt and become resistant to treatment. LinG3D can help uncover spatial patterns of clonal evolution and intratumoral niches that are prone to the development of resistance. By incorporating data on microenvironmental parameters such as drug concentration and oxygen levels, LinG3D allows researchers to model and evaluate the effects of different treatment options on tumor evolution. This may help researchers develop strategies to target these niches, reduce resistance, and enhance treatment effectiveness.
Moreover, LinG3D is available in MATLAB, Python, and R [3] and offers researchers routines for examining the growth of specific clones, tracing all generated cells, or analyzing evolutionary patterns across multiple clones using data from computer simulations and experimental tests.
In summary, LinG3D represents a significant improvement in our understanding of spatial aspects of tumor evolution. By integrating spatial information into traditional lineage trees, LinG3D provides researchers with a powerful tool for studying the spatial dynamics of cancer growth and response to treatments. LinG3D is not just a tool—it's a platform for discovery.
References
- Hu A., Ojwang' A.M.E., Olumoyin K.D., Rejniak K.A., "LinG3D: Visualizing the Spatio-Temporal Dynamics of Clonal Evolution", BMC Bioinformatics, (2024) 25:201, doi:10.1186/s12859-024-05813-7
- Noble R, Burri D, Le Sueur C, Lemant J, Viossat Y, Kather JN, et al. "Spatial structure governs the mode of tumour evolution", Nat Ecol Evol. (2022) 6,207-217, doi:10.1038/s41559-021-01615-9
- Data and code repositories: https://github.com/rejniaklab/LinG3D, https://github.com/rejniaklab/pyLinG3D, https://github.com/rejniaklab/r_LinG3D
© 2026 - The Mathematical Oncology Blog