Combining multiple spatial statistics enhances the description of immune cell localisation within tumours
Joshua A. Bull, Philip S. Macklin, Tom Quaiser, Franziska Braun, Sarah L. Waters, Chris W. Pugh, Helen M. Byrne
Read the paper
Describing where immune cells are located within a tumour is important for many reasons. Taking macrophages as an example, whether they are located mostly within the tumour or in associated stroma correlates with patient prognosis in a wide range of tumours. Immune cell localisation is particularly important when it comes to immunotherapies, whose success may depend on where immune cells are concentrated.
Fortunately, pathology is becoming increasingly digitised. As slide scanning becomes more widespread, this creates an opportunity to use computer vision algorithms to analyse extremely high-resolution images. Many algorithms have been designed to find positively stained cells from immunohistochemistry (IHC) images. While this is not a trivial task, image analysis is becoming more accessible to non-coders (including via open source software such as QuPath) and the performance of cell identification algorithms is constantly improving.
So, if we assume that we can identify the locations of individual immune cells – say, macrophages – from an IHC image, then the question becomes: now what? What can we do with this information? Using (x,y)-coordinates of macrophages we can certainly calculate statistics like cell counts or densities more accurately than via manual assessment, but a lot more information is not captured by these descriptions. More detailed analyses might involve spatial statistics which can provide information about relationships between pairs of points, or techniques such as topological data analysis (TDA) which can describe the structure of a dataset.
While there are an array of mathematical and statistical techniques which could be used to describe this type of point cloud data, it is unclear which should be prioritised. The current state-of-the-art description of immune cell infiltration is manual evaluation by a pathologist; no mathematical descriptor is quite able to capture this yet.
Our aim in this paper was to explore ways in which different spatial statistics could be combined to approximate pathologists' evaluations.
We decided to focus on macrophage localisation within tumour or stroma, using only the (x,y) coordinates of the macrophages (i.e., no labelling to distinguish tumour from stroma, as this is generally unavailable). In an ideal world, we'd calculate different spatial statistics from a huge dataset of manually labelled point patterns, and use that to infer the labelling. Unfortunately, such datasets are difficult to come by. So, being mathematical modellers at heart, we decided to make one.
We generated synthetic point patterns that imitated point patterns from real IHC images: each pattern was based on an underlying "tumour/stroma" map, which could be varied programmatically to produce regions with small and highly mixed tumour and stroma areas, or regions with large, distinct areas. We placed points within these regions to mimic the locations of macrophages in the real images. A key parameter, ρ, describes the ratio of macrophages in the simulated tumour to the stroma. Varying ρ produces images which appear to have different degrees of macrophage infiltration into the tumour regions. This suggests that identifying the value of ρ used to generate a point pattern by observing a range of spatial statistics could be a stepping stone to describing infiltration in IHC images.
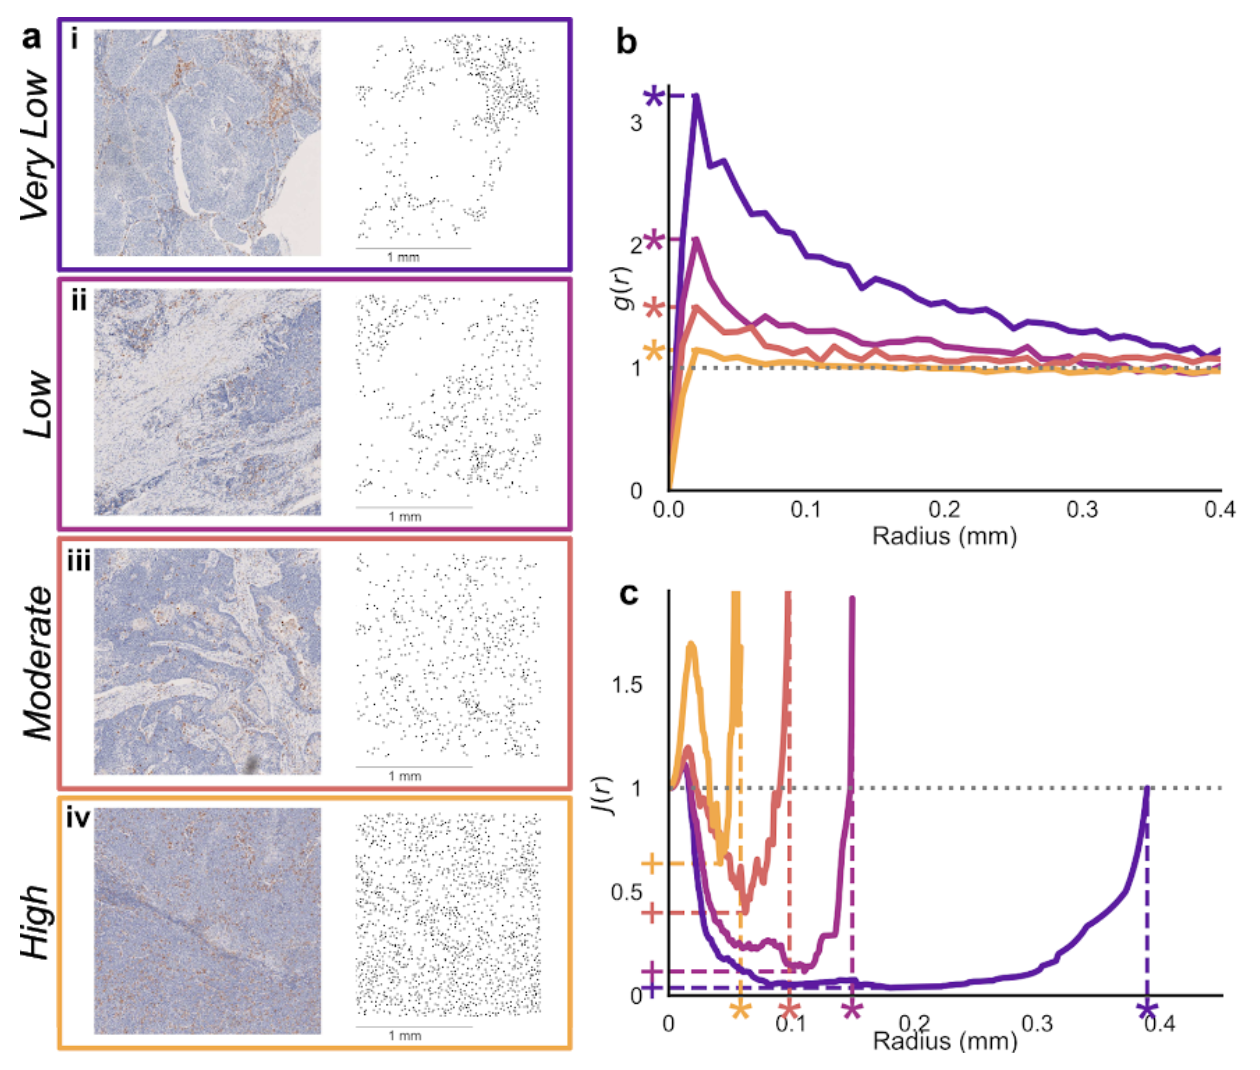
Figure 1. (a) regions taken from head and neck cancer IHC slides showing macrophage locations, evaluated as having differing levels of macrophage infiltration into tumour nests.
Features of spatial statistics like the pair-correlation function (b) and J-function (c) correlate with pathologist’s evaluations, and so can be used to identify a metric which is predictive of these descriptions.
We focussed on three statistics which correlated with ρ in simulated data (the peak of the pair-correlation function, the minimum value of the J-function, and the largest value in the spherical-contact distribution). Using maximum likelihood estimation based on observed distributions in this data, we predicted ρ using different combinations of these statistics for new simulated point patterns. Observations of multiple statistics increased the accuracy of our predictions, and led to tighter confidence intervals. Finally, we used the same method to assign labels to images from IHC slides which had been evaluated by a pathologist. Combining observations of the three statistics we considered led to more precise predictions of pathologists scoring.
While the combination of three statistics that we considered isn't powerful enough to define a new metric for describing immune cell infiltration, our approach is a proof-of-concept which can be used to combine a much wider array of statistics. Our next steps will be to identify combinations of statistics which can more accurately reproduce pathologist's classifications, and to explore links between the classifications and patient outcomes.
References
- Bull, J.A., Macklin, P.S., Quaiser, T. et al. Combining multiple spatial statistics enhances the description of immune cell localisation within tumours. Sci Rep 10, 18624 (2020). https://doi.org/10.1038/s41598-020-75180-9