Quantifying Tumor Heterogeneity
Expression variation analysis quantifies the diversity of molecular states in cancer from single cell data
Differential variation analysis enables detection of tumor heterogeneity using single-cell sequencing data
Davis-Marcisak et al. (2019), Cancer Research
Read the manuscriptExpression variation analysis is a tool to compute differential variation from single cell data
The problem of tumor heterogeneity led us to develop a new mathematical framework called Expression Variation Analysis (EVA). This approach compares variation across profiles of genes between two groups of samples (link). We previously applied this technique to quantify regulatory mechanisms in tumors, including gene splicing (link) and epigenetic regulation (link). This method is available in open source software for the R programming language from Bioconductor (link). At the same time, new single cell technologies provide an unprecedented opportunity to measure the transcriptional profile of individual cells within a tumor. Coupling these data with analysis with the EVA algorithm can quantify the molecular pathways that are associated with intra-tumor heterogeneity. To explain how the algorithm works, we will use the example of an analysis that compares tumor and normal cells for genes in the molecular pathway that regulates the cell cycle, PI3K. Briefly, from the single cell dataset we select only those genes that are associated with the PI3K pathway as determined from a curated database. EVA then applies a distance metric to quantify the dissimilarity of the expression values for the genes between every pair of tumor cells and between every pair of normal cells. The so-called EVA statistic represents the average of the dissimilarity between each pair of cells from a single group. The statistical test in EVA can provide a p-value that tests whether the dissimilarity in tumor cells is the same as that of normal cells. In all, this provides a comprehensive statistical framework to compare the molecular variation between different groups of samples.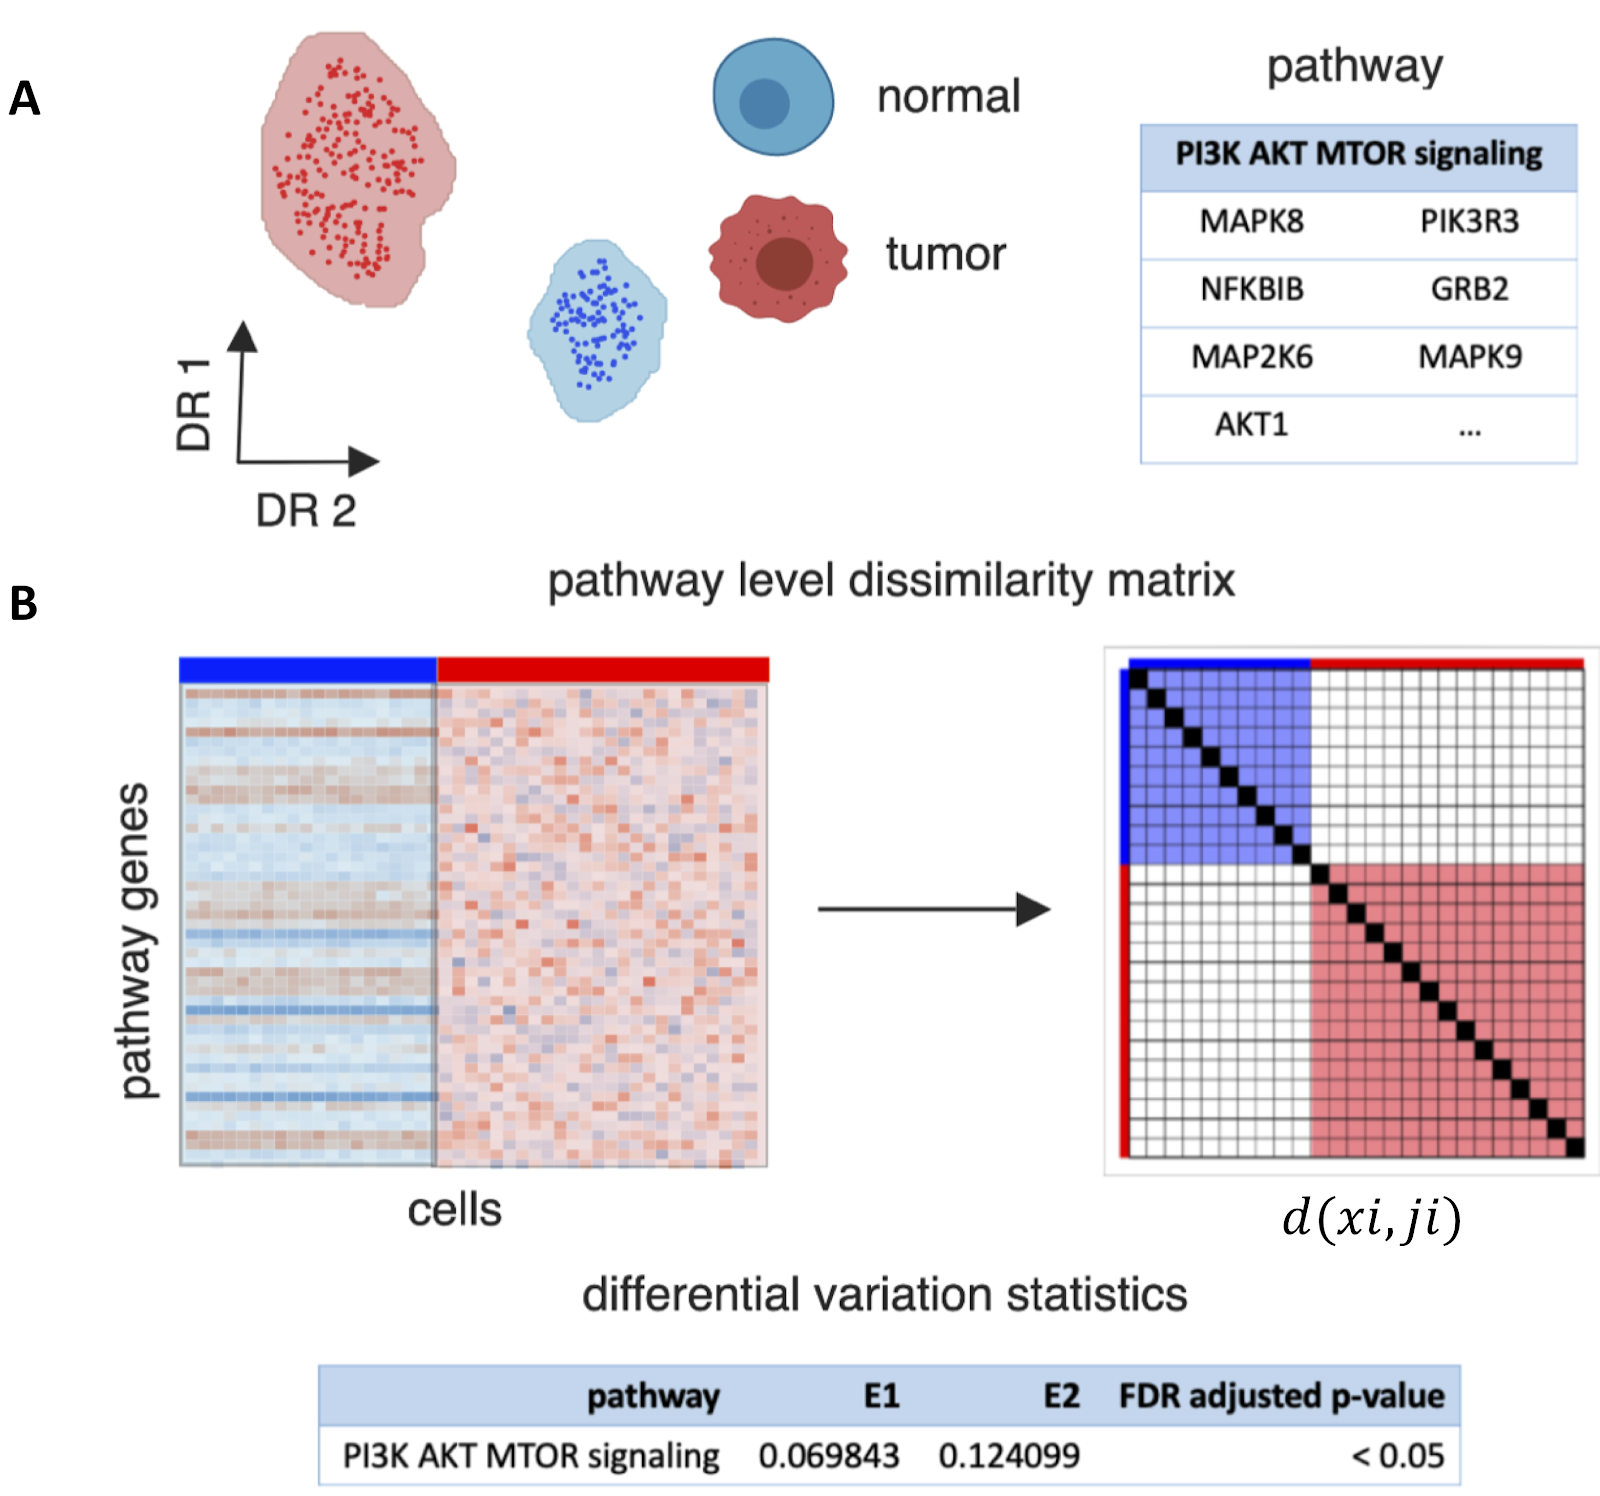
Benchmarking the EVA algorithm demonstrates the need for correct for missing data from single cell technologies with analysis that rely on dissimilarities between cells.
We performed several performance benchmarks on both simulated and real data to demonstrate the robustness of EVA for single cell analysis. These benchmark studies demonstrate the importance of correcting for technical artifacts that arise in single cell data. Specifically, we show that a broad range of dissimilarity metrics are particularly sensitive to genes that are not measured by single cell technologies due to so called “dropout”. Imputation methods that correct for these artifacts, such as MAGIC (link) are essential to obtain reliable results from EVA. This comparison study shows the importance of imputation not only for EVA but for any algorithm that depends upon calculations of distances between expression profiles between cells. In contrast, previously we have found this correction is not necessary for accurate pattern detection from single cell data (link). Altogether, this suggests that the optimal preprocessing method for single cell data is not one size fits all, but instead depends on the type of analysis that is being performed.Applications of EVA to discover new tumor biology
Once the algorithm was benchmarked, we applied it to learn the role of intra-tumor heterogeneity in cancer using single cell datasets from breast (link) and head and neck tumors (link). In the case of breast cancer, the dataset had single cell data both of gene expression and T cell receptor sequences. When the immune system responds, specific T cells involved in this process expand increasing the so called “clonality” of the receptor sequences for those cells. We apply EVA to compare molecular heteogeneity as a function of this clonality. We find that the molecular states of all immune cells from tumors with greater clonality also have greater molecular heterogeneity in immune pathways. This heterogeneity suggests a wide range of immune cell activation in these tumors.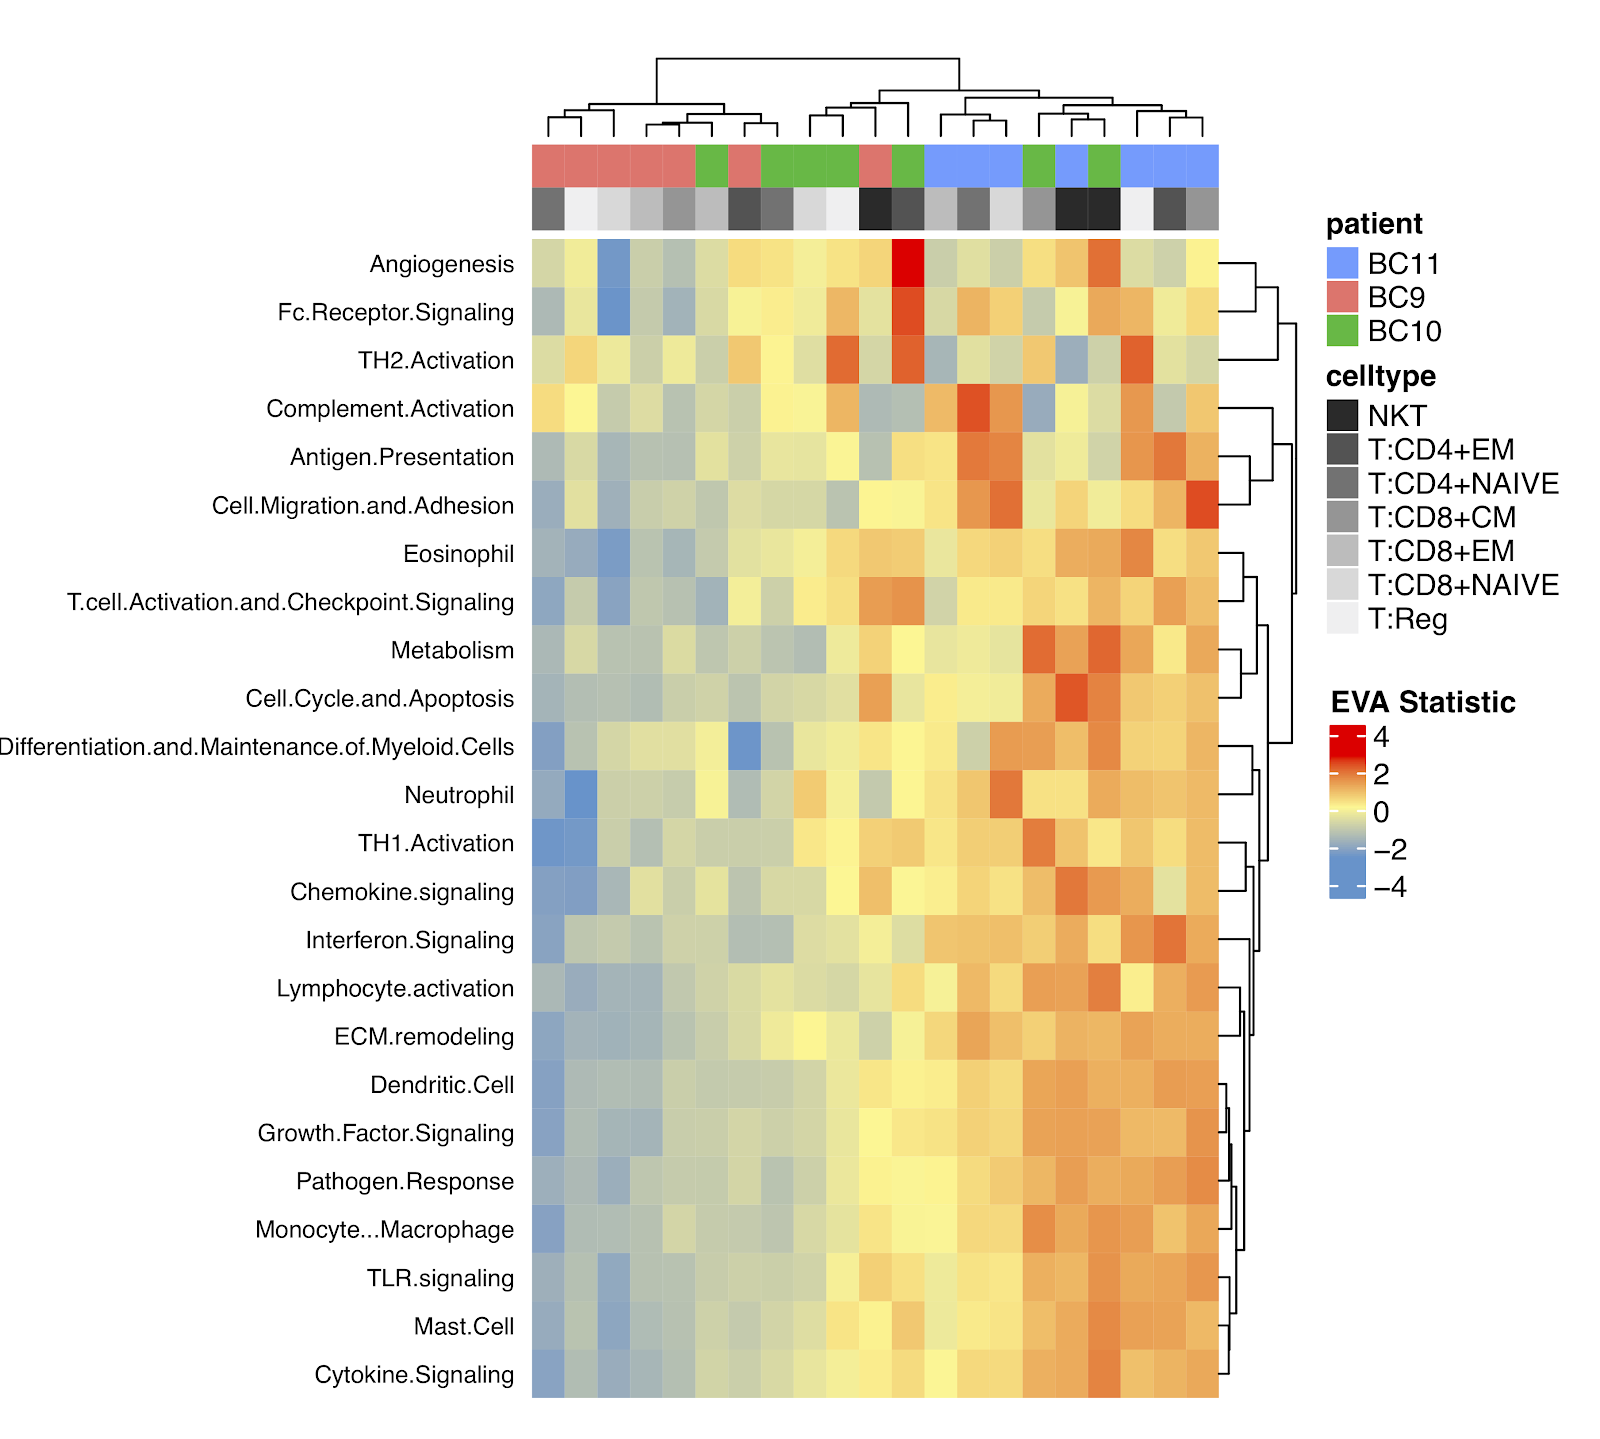 Heterogeneity is also thought to play a critical role in metastasis. In the clonal model of hypothesis, a rare subclone in the primary tumor is thought to disseminate and survive in a new environment and generate a metastasis. In the case of head and neck cancers, clustering approaches used in the original manuscript did not distinguish the transcriptional profiles of cancer cells in the primary tumors and metastases (link). EVA is able to detect greater transcriptional heterogeneity in cancer cells from primary tumors than corresponding lymph node metastases in three of five patients, consistent with the clonal model of tumor metastasis. It will be critical to extend this analysis to larger single cell studies of metastasis to determine the alternative to the clonal model of metastasis in tumors that do not follow this trend.
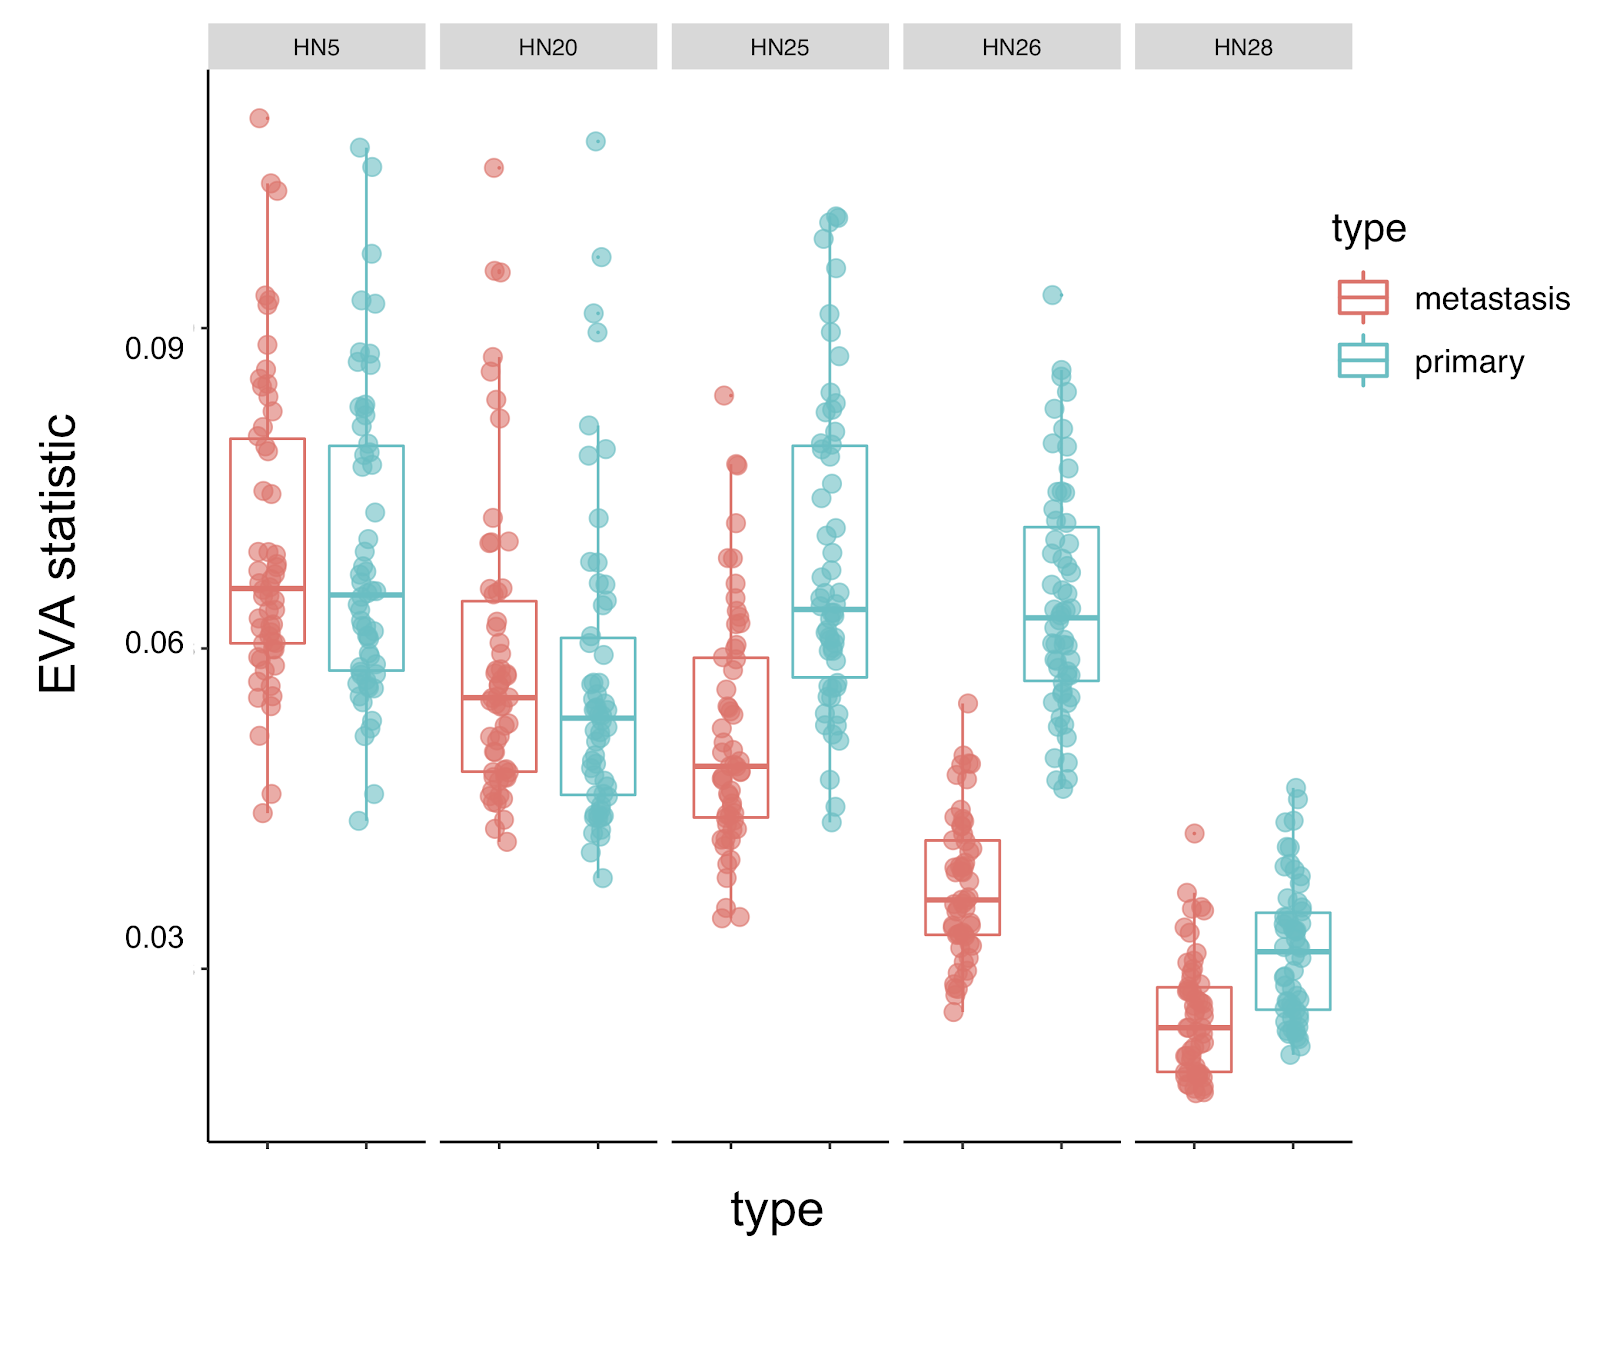
Molecular heterogeneity has a critical role in biology beyond cancer
In this paper, we demonstrate that EVA provides a robust tool to quantify transcriptional heterogeneity from single cell data in cancer. The software for this analysis is fully available to enable further applications. While particularly pertinent for tumor biology, we note that EVA has broad ranging applicability to other biological and disease systems in which molecular diversity plays a role. For example, using EVA we observe greater variation in the expression of cell cycle genes as the mouse retina develops (link), reflective of desynchronization of cellular divisions as stem cells differentiate into distinct cell types.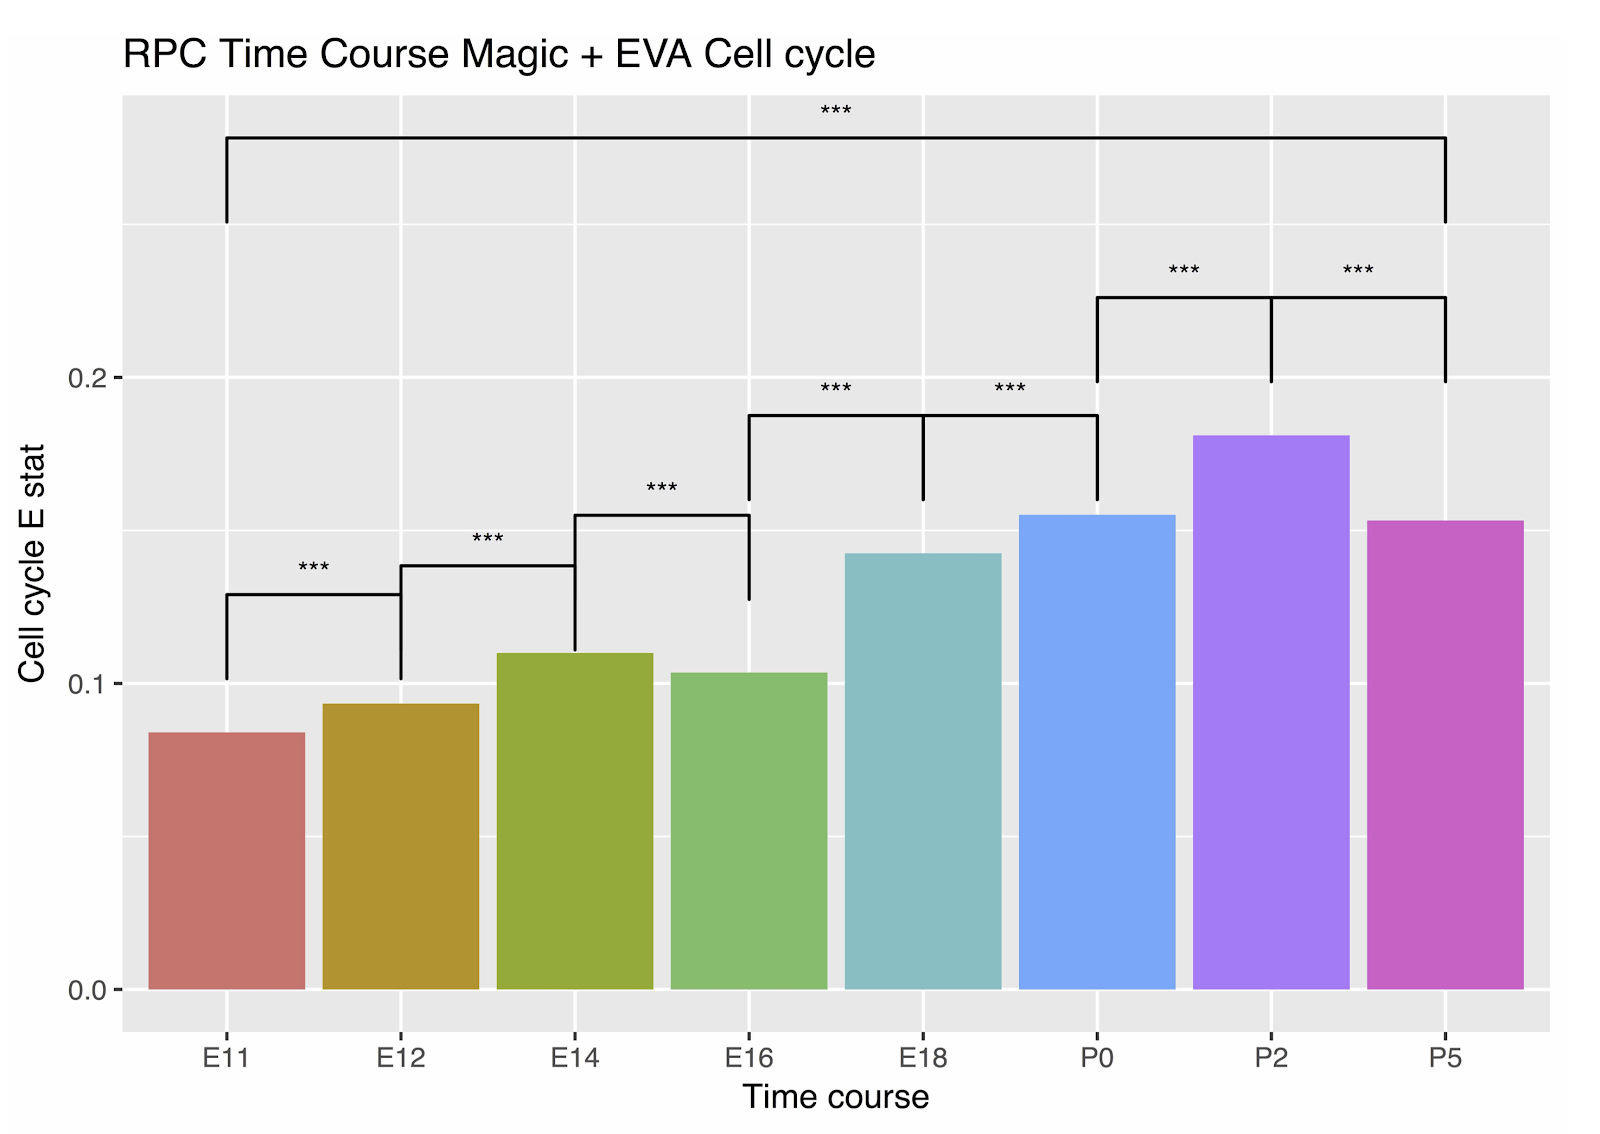
© 2026 - The Mathematical Oncology Blog