Joint single cell DNA-seq and RNA-seq of gastric cancer cell lines reveals rules of in vitro evolution
Noemi Andor, Billy T Lau, Claudia Catalanotti, Anuja Sathe, Matthew Kubit, Jiamin Chen, Cristina Blaj, Athena Cherry, Charles D Bangs, Susan M Grimes, Carlos J Suarez, Hanlee P Ji
NAR Genomics and Bioinformatics
Read the article
A tumor is often not a single disease, but multiple related ones. If you confront them with say chemo- or radiation therapy, they may well not react in the same way. Some may die, but others will survive and strive on resources set free by the death of the former. And there you have your chemo-resistant tumor. This calls for a personalized therapy approach.
Personalized oncology is a term often used to describe the idea of assigning tumors to boxes – there is a finite number of boxes and depending on which box you land in, your treatment will be different
1–3. Whether this will suffice for therapeutic success is debatable: in each of four boxes, you may find another four, and then another few in each of these sub-boxes. This would be fine; if the tumor were to stay in its initial box, we would eventually, after a long time, uncover all boxes. But the problem is, when confronted with its allocated therapy strategy the tumor will invent yet another box that we have not encountered yet! This is the worst-case scenario of cancer biology – not that every tumor is unique, but that the most effective, long-term treatment for every tumor is unique too and that most tumors will adapt even to that “best treatment”, that in order to achieve a long-term response therapeutic actions must evolve as quickly as the tumor does. For this scenario, a wider search space increases the chance of therapeutic success; the handful of drugs that are approved for a given tumor type may not suffice. Nor are we going to find an arsenal of new drugs within a decade. I propose the following hypothesis:
the combination of means necessary to push any tumor into remission exists already; the challenge is to find the right combination among tens of thousands of drugs, biologics and nutraceuticals approved for clinical use.
Cell lines are ideal model systems to begin testing this hypothesis. This statement may spark objections, as cell lines have often been criticized for how little they resemble primary tumors. Two major studies from Todd Golub's group, led by Uri Ben-David, showed that cancer cell lines diverge from the primary tumor from which they originate and divergence only increases with passaging
4,5. But this critique is likely a consequence of deploying cell lines to answer questions they’re not well suited to answer, such as drug screening. Applications such as this brought denial upon the scientific community, forcing us to assume cancer cell lines are genetically homogeneous and more or less stable, in order to justify experimental designs. Accumulating evidence that this is not the case is primarily seen as a tremendous inconvenience. But this paradigm shift places these model systems closer to the clinical reality of primary tumors, which also adapt and change in response to their environment.
First steps towards deploying cell lines in this new manner are to characterize their heterogeneity. Quantifying heterogeneity within a cell population remains a challenge, but is becoming easier as technology advances. What makes it easier is the emerging single cell technology, enabling us to sequence thousands of single cells separately. This contrasts to bulk sequencing, where we obtain millions of puzzle pieces, but don’t know which piece belongs to which cell – so the resulting profile is a weighted average sequencing profile. With single cell sequencing (sc-Seq) you know exactly which piece comes from which cell. But scDNA-Seq for example, will give you just one perspective on the tumor’s population composition. If you look at the cell’s RNA instead of the DNA, you will see a different picture. And yet another if you look at imaging data. It’s like having a set of different sensors – one that measures molecular weight, the other measures emission spectrum wavelengths, yet another measures half-life of a molecule – none of them give the complete picture. Integration of these perspectives is challenging but plays an important role. Because what we ultimately want to know is not how subpopulations differ in their DNA or RNA, but we’re interested in that outline of subpopulations that defines differential drug sensitivities. Integrating multiple perspectives is more likely to achieve this, than looking at a single angle.
In a recent
article published in NAR Genomics and Bioinformatics6, we describe results from integrating scDNA and scRNA-Seq of a cumulative total of more than 37K cells to learn about in-vitro adaptation, evolution and heterogeneity of nine gastric cancer cell lines.
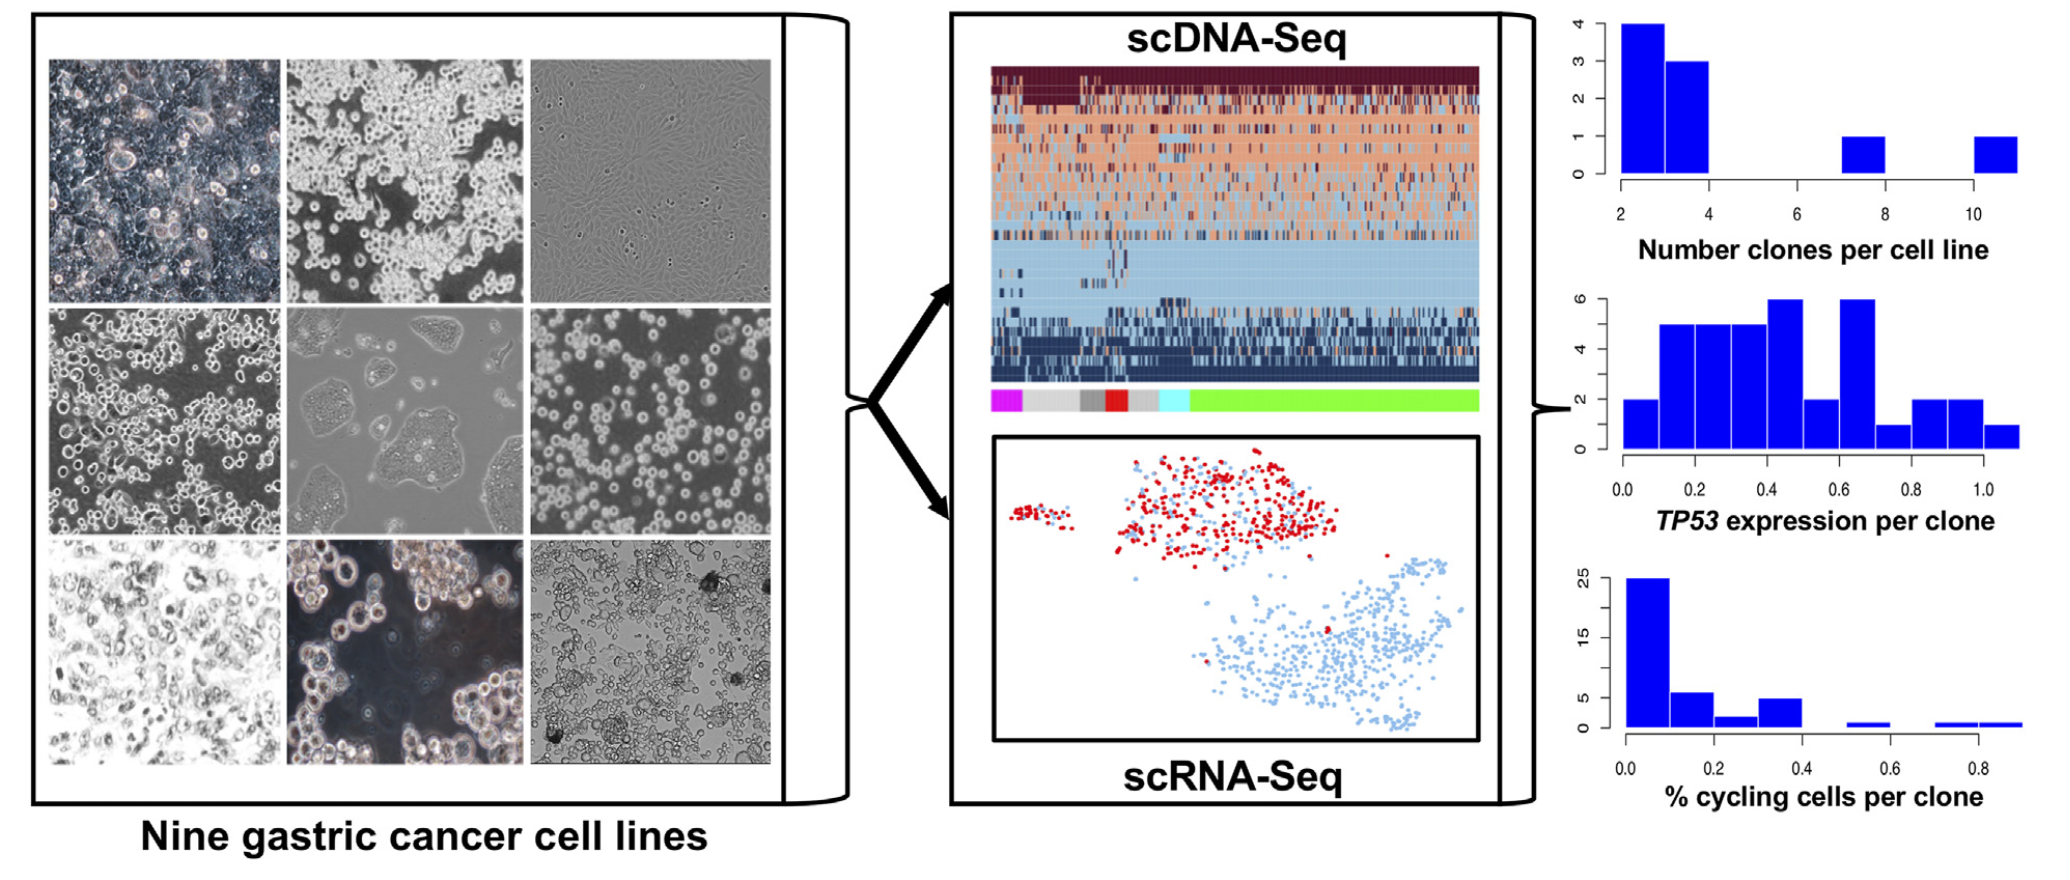
Figure 1: Study design. Joint single cell DNA and RNA sequencing of nine gastric cancer cell lines. Clonal diversity was extensive and readily distinguished among the cell lines. TP53 gene expression and the number of actively cycling cells varied across subclones.
Integrated single cell sequencing informs both, what genes a cell expresses, and to which genetic subpopulation it belongs. Snapshots of transcriptomes and genomes that coexist in a cell line tell us how well the cells have adapted to culture conditions, and which group of cells is actively expanding or regressing:
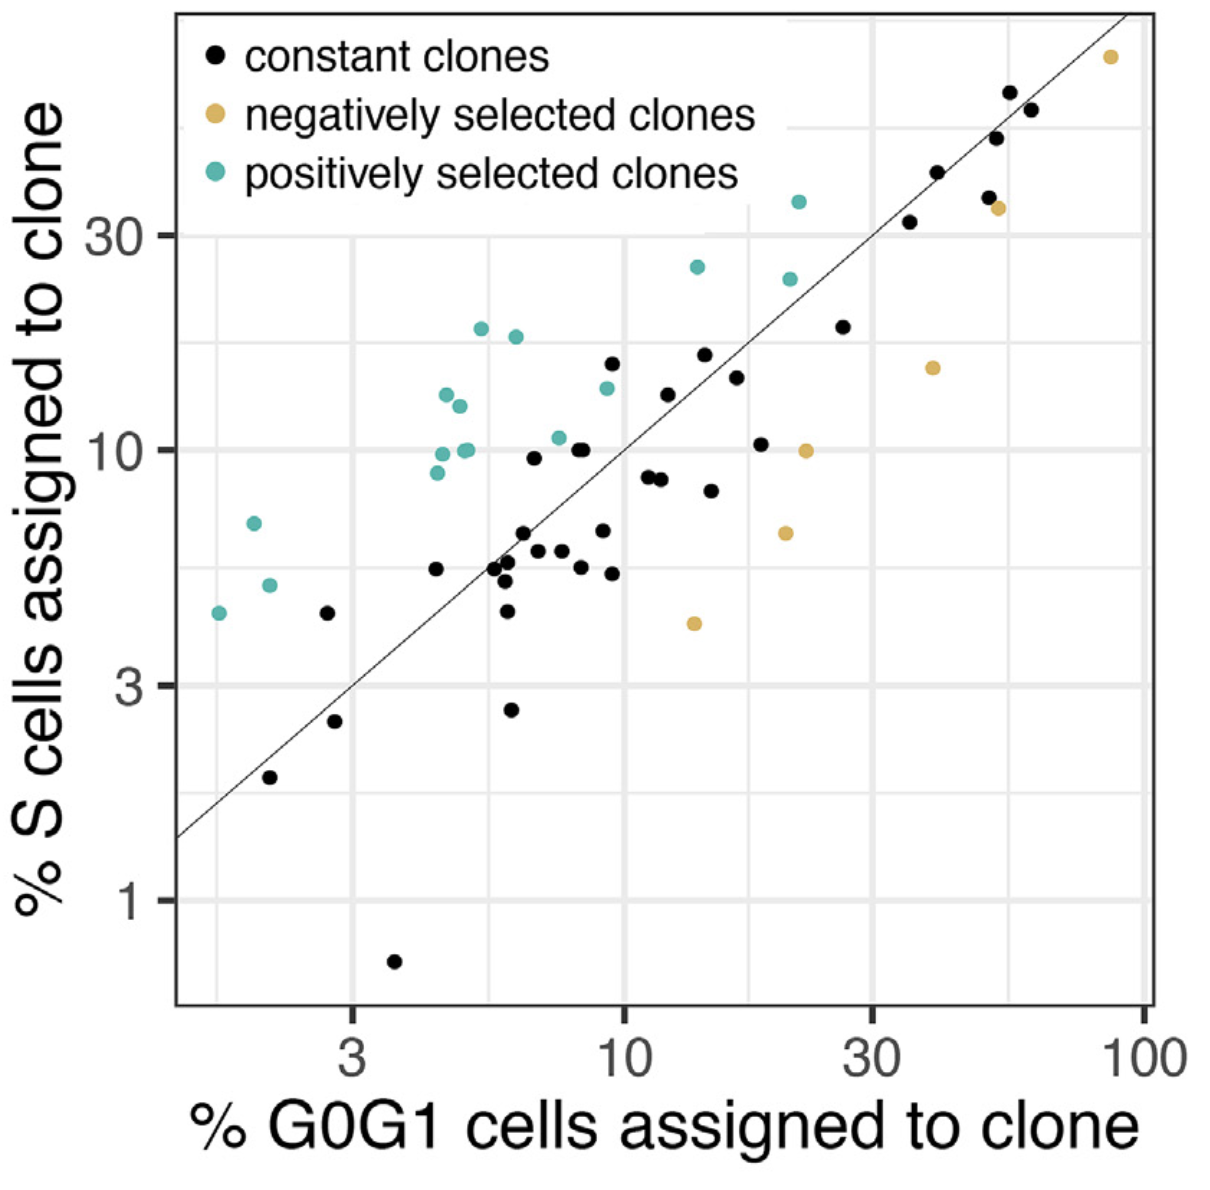
Figure 2: The percentage of replicating cells per clone increased with percentage of G0/G1 cells per clone in NCI-N87 as well as in the other eight cell lines, indicating clonal stasis (Pearson r = 0.88; p < 2e-16). Selection of clones (color-coded) was calculated as probability of sampling the % replicating cells observed for a given clone, conditional on the G0/G1 representation of that same clone using the hypergeometric distribution. Clones were assigned to three groups: positive selection (n=17), no selection (n=34) and negative selection (n=6).
Even after decades of in-vitro growth, established cell cultures continue to change. Using these in-vitro systems to study specific drug sensitivities should be limited to a narrow time window, where the subpopulation composition of the cell line is expected to stay within a predefined range. The width of this window depends on the cell line’s ploidy and the number of years since it has been in culture, so our results suggest.
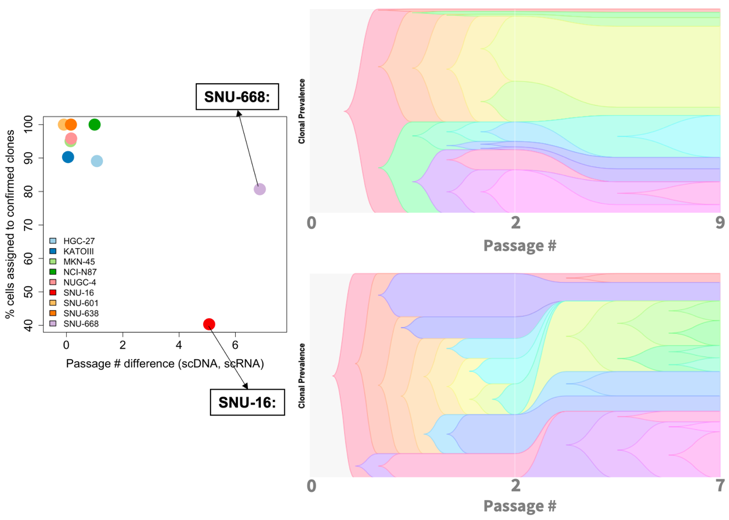
Figure 3: Differences in passage number between scDNA- and scRNA-Seq experiments for SNU-668 and SNU-16 accompany differences in clonal composition observed between the two techniques.
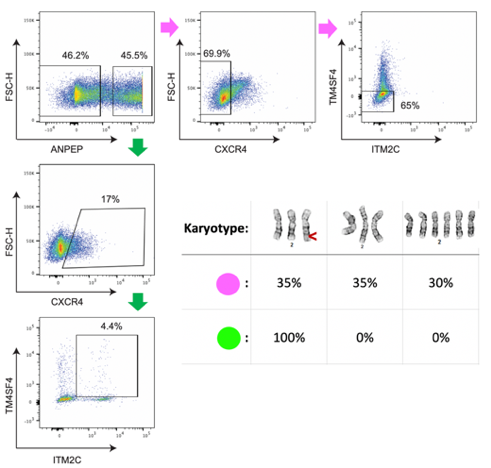
We identified cell surface markers for two genetically defined subpopulations in the NUGC-4 cell line and used flow cytometry to enrich for each. In the future this approach can be leveraged to test subpopulation-specific drug sensitivities without having to re-sequence the population each time after drug exposure to see which subpopulation survived.
Figure 4: We used flow cytometry with four markers to enrich for two genetically defined subpopulations. Cytogenetic analysis of chromosome 2 identified three karyotypes among the two isolated subpopulations (top row), including a rearrangement on the q-arm (red arrow). All of the cells (100%) from the green subpopulation had a chromosome 2q rearrangement, whereas the pink subpopulation contained only 35% cells with the rearrangement.
These findings call for a collective effort to track the pedigree of evolving cell lines over decades along with potentially changing cell culture habits. Such efforts could help reveal long-term trends in the evolution of cell lines, that remain elusive at shorter time-scales. After all, the influence of a single lab on the evolution of an established cell line is limited in the scheme of things: just a small fraction in a decades old development. A system that tracks clones and how they change over time may open the path to answer difficult questions such as: in what direction do changes in culture conditions steer a cell line’s subpopulation composition?
Success in the clinical setting requires an experimental setting in which our therapeutic solutions are challenged with the adaptive nature of cancer. Let’s redefine what success means when it comes to working with cell lines, namely not to kill the entire cell line, but to kill a specific subpopulation within the cell line.
Let cell lines be our training camps where we learn to control the evolution of a cancer population over time7.
Further reading
- Northcott PA, Dubuc AM, Pfister S, Taylor MD. Molecular subgroups of medulloblastoma. Expert Rev Neurother. 2012;12:871–84.
- Dai X, Li T, Bai Z, Yang Y, Liu X, Zhan J, et al. Breast cancer intrinsic subtype classification, clinical use and future trends. Am J Cancer Res. 2015;5:2929–43.
- Verhaak RGW, Hoadley KA, Purdom E, Wang V, Qi Y, Wilkerson MD, et al. Integrated genomic analysis identifies clinically relevant subtypes of glioblastoma characterized by abnormalities in PDGFRA, IDH1, EGFR, and NF1. Cancer Cell. 2010;17:98–110.
- Ben-David U, Siranosian B, Ha G, Tang H, Oren Y, Hinohara K, et al. Genetic and transcriptional evolution alters cancer cell line drug response. Nature. 2018;560:325–30.
- Ben-David U, Ha G, Tseng Y-Y, Greenwald NF, Oh C, Shih J, et al. Patient-derived xenografts undergo mouse-specific tumor evolution. Nat Genet. 2017;49:1567–75.
- Andor N, Lau BT, Catalanotti C, Sathe A, Kubit MA, Chen J, et al. Joint single cell DNA-seq and RNA-seq of gastric cancer cell lines reveals rules of in vitro evolution. NAR Genomics Bioinforma Press. 2020;
- The Clonal Redesign Lab: cloneredesign.com