Click the image below to view the full size version of this
cover.
Created by: Rob Noble
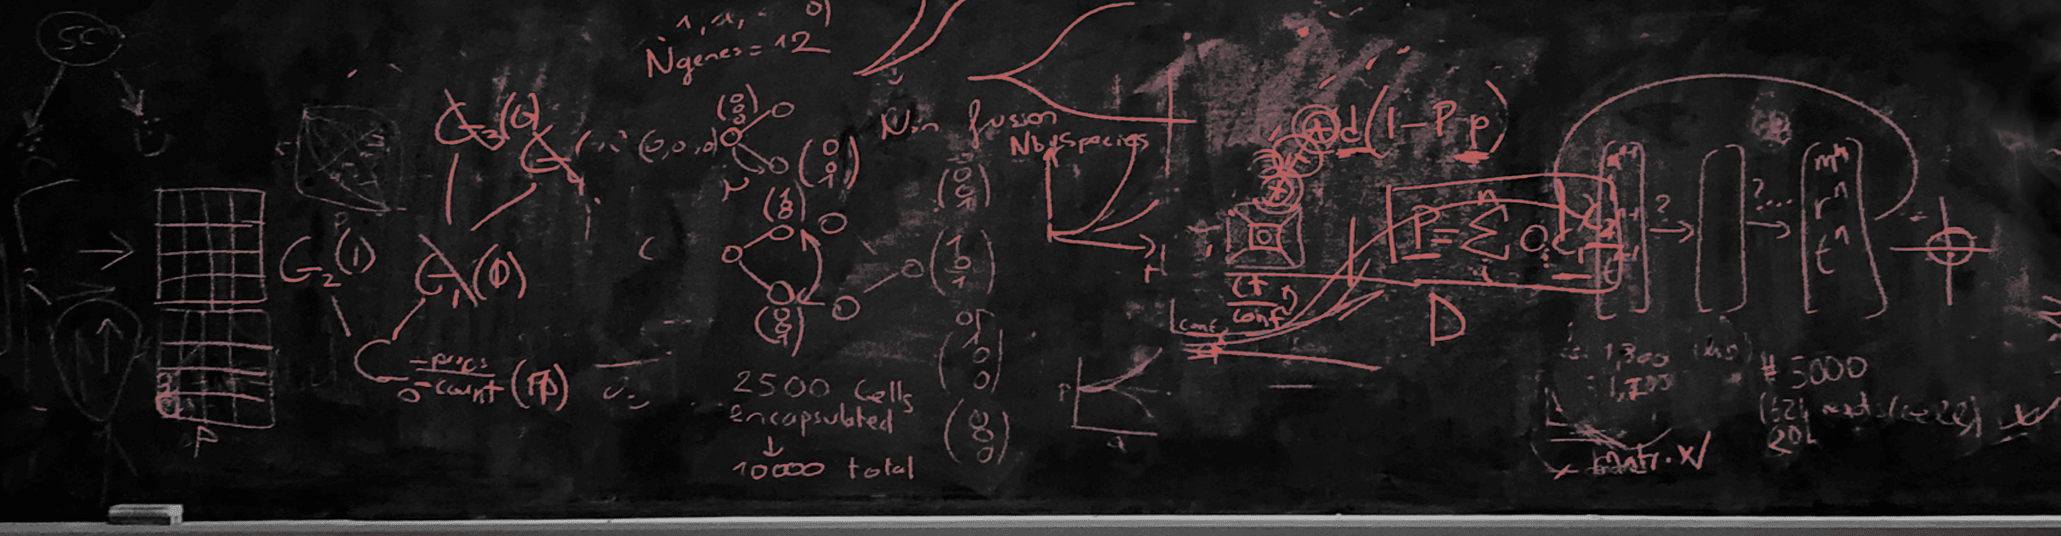
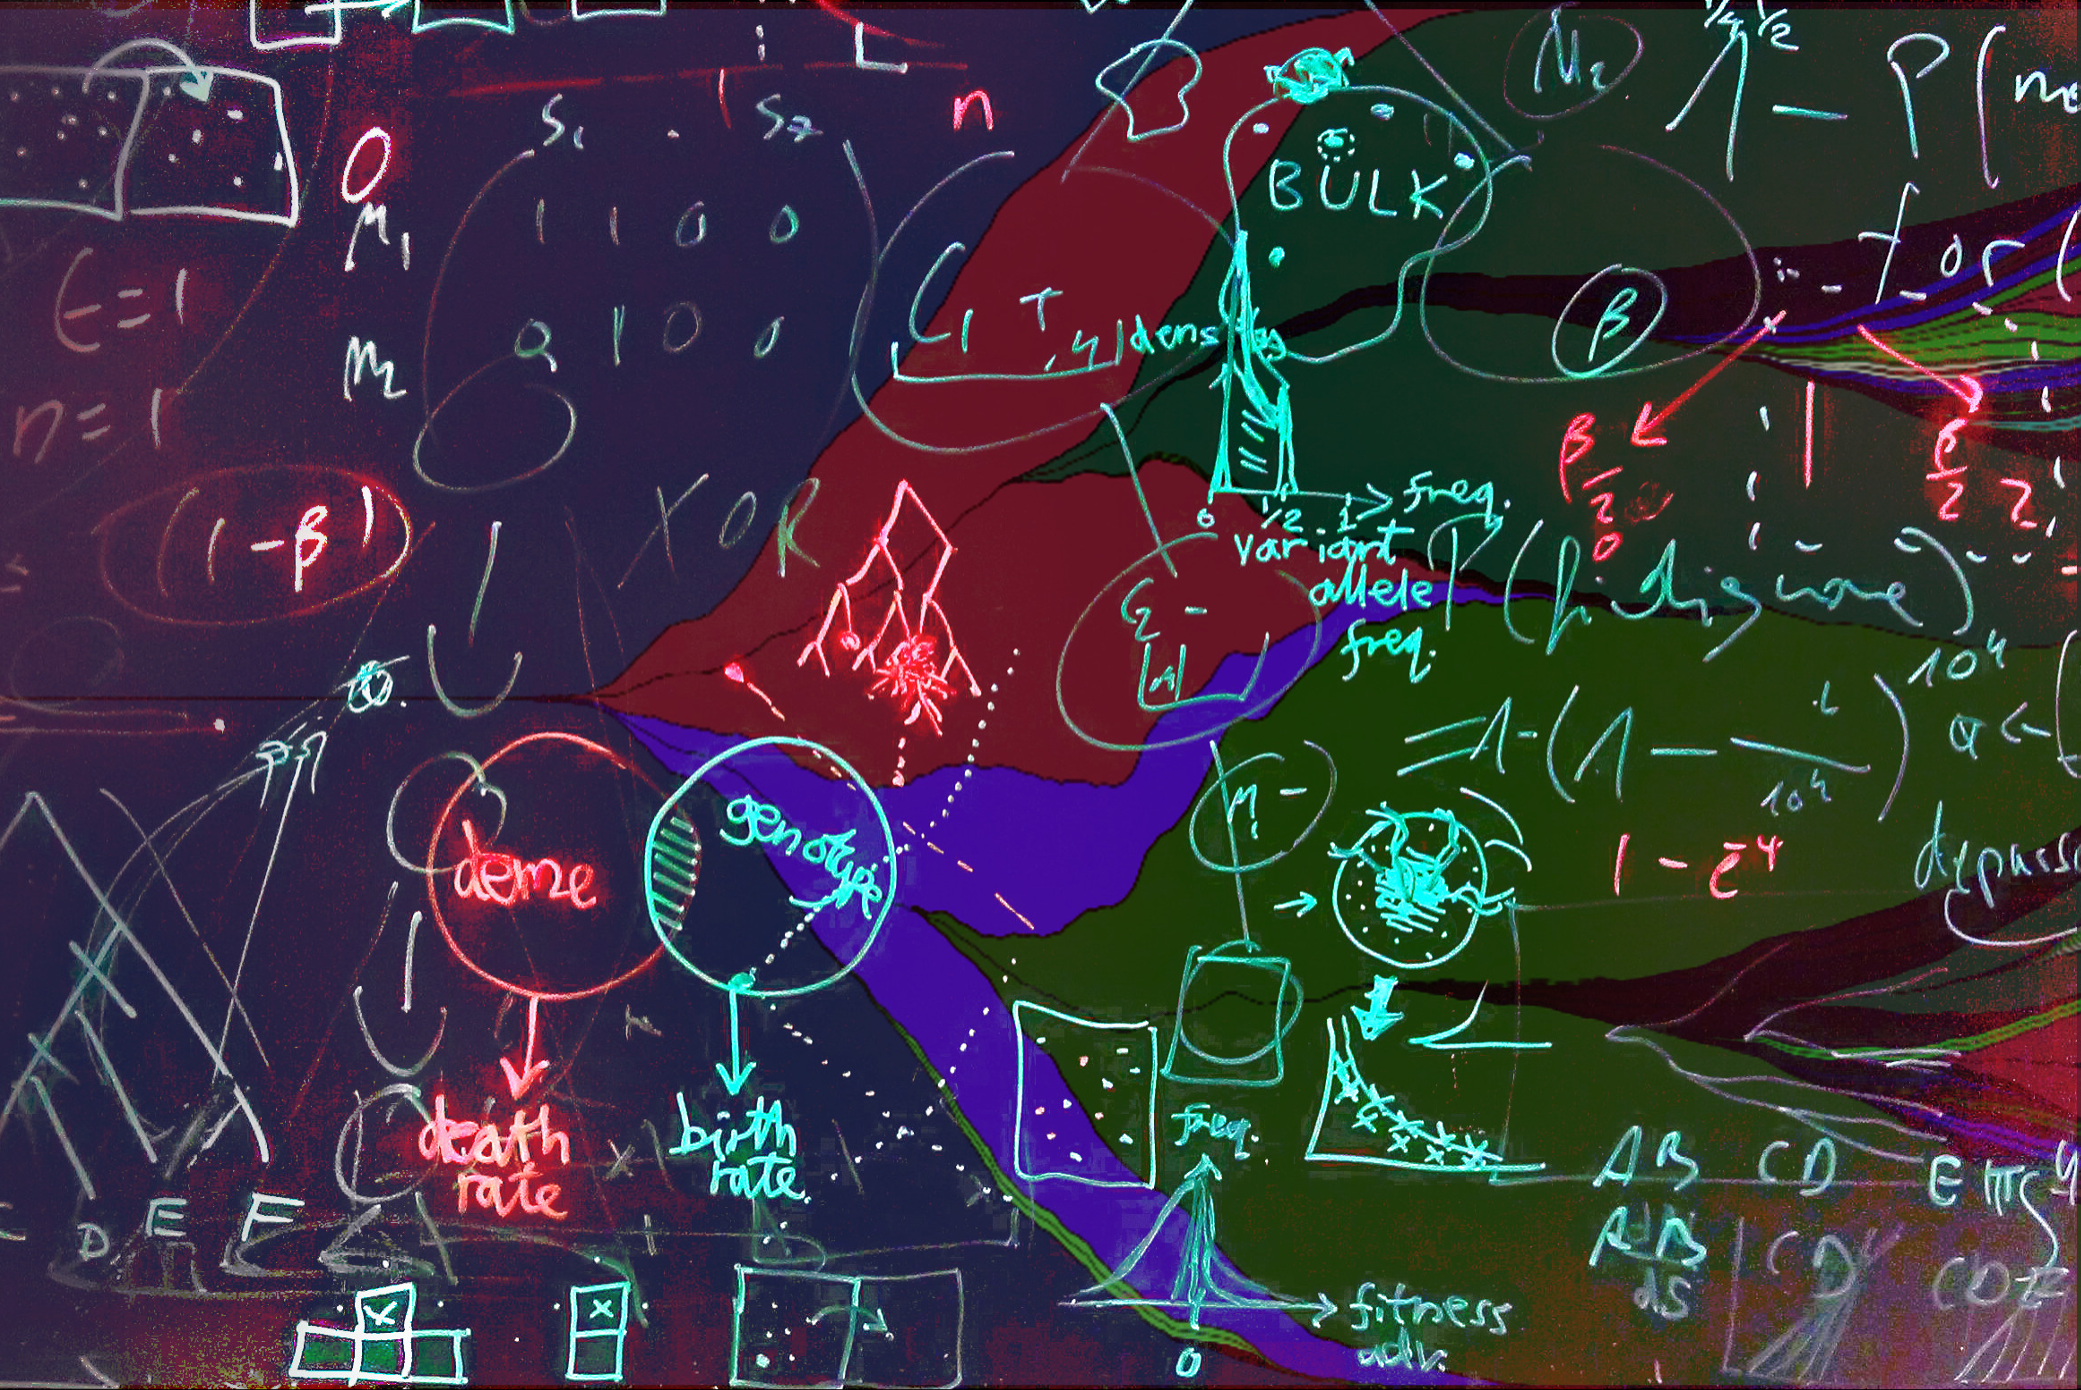
Issue 192: This image shows my office whiteboard circa late 2017, superimposed on a Muller plot from the paper that grew out of the scrawling. The Venn diagram labelled 'deme' and 'genotype' captures a central assumption of my computational model of tumour evolution. See if you can also spot drawings related to variant allele frequencies, multiregion sampling, the distribution of mutation effects, cellular automaton rules, island models, and tree diagrams. For more detail, read here.
© 2026 - The Mathematical Oncology Blog