Click the image below to view the full size version of this
cover.
Created by: Masud M A, Eunjung Kim
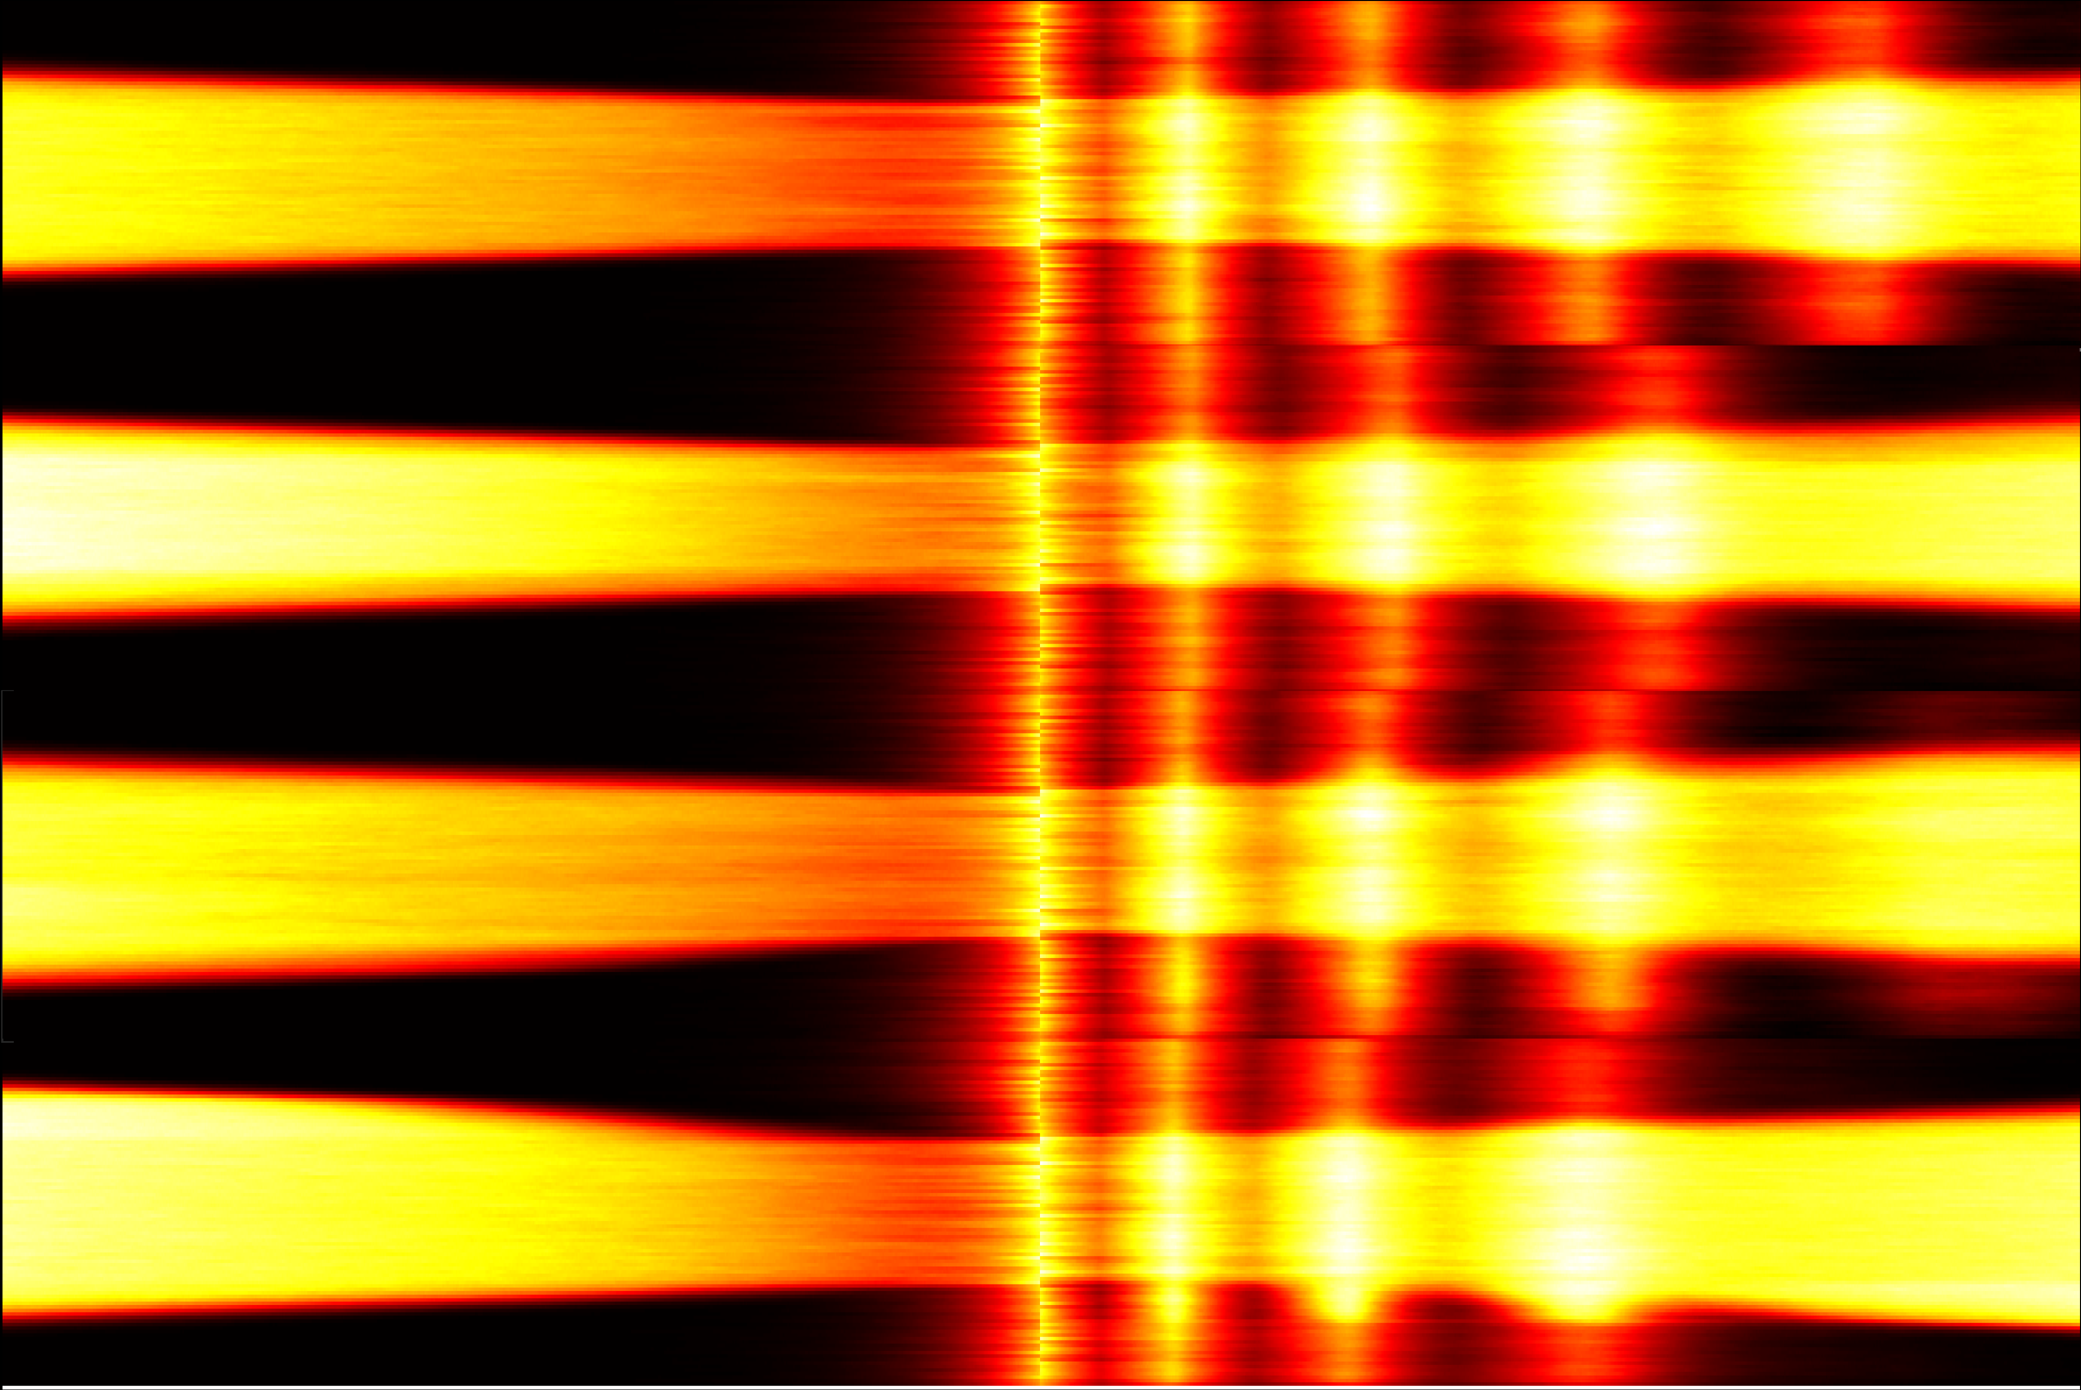
Issue 207: The artwork represents some results of our recent study investigating the consequence of spatial distribution of fibroblast and resistant cells on the therapy outcomes. Our analysis shows that the time to progression is correlated with the area of fibroblast impact. Towards left (from the middle) it shows the cell population count under maximum tolerated continuous therapy. Towards right (from the middle) it shows the same under adaptive therapy. The first row shows tumor growth without fibroblast, while the other three rows show tumor growth with different fibroblast structures which accelerate the progression under both type of treatment strategy. The fourth row shows the quickest progression as it is for the case with largest area of impact.