Click the image below to view the full size version of this
cover.
Created by: Etienne Baratchart
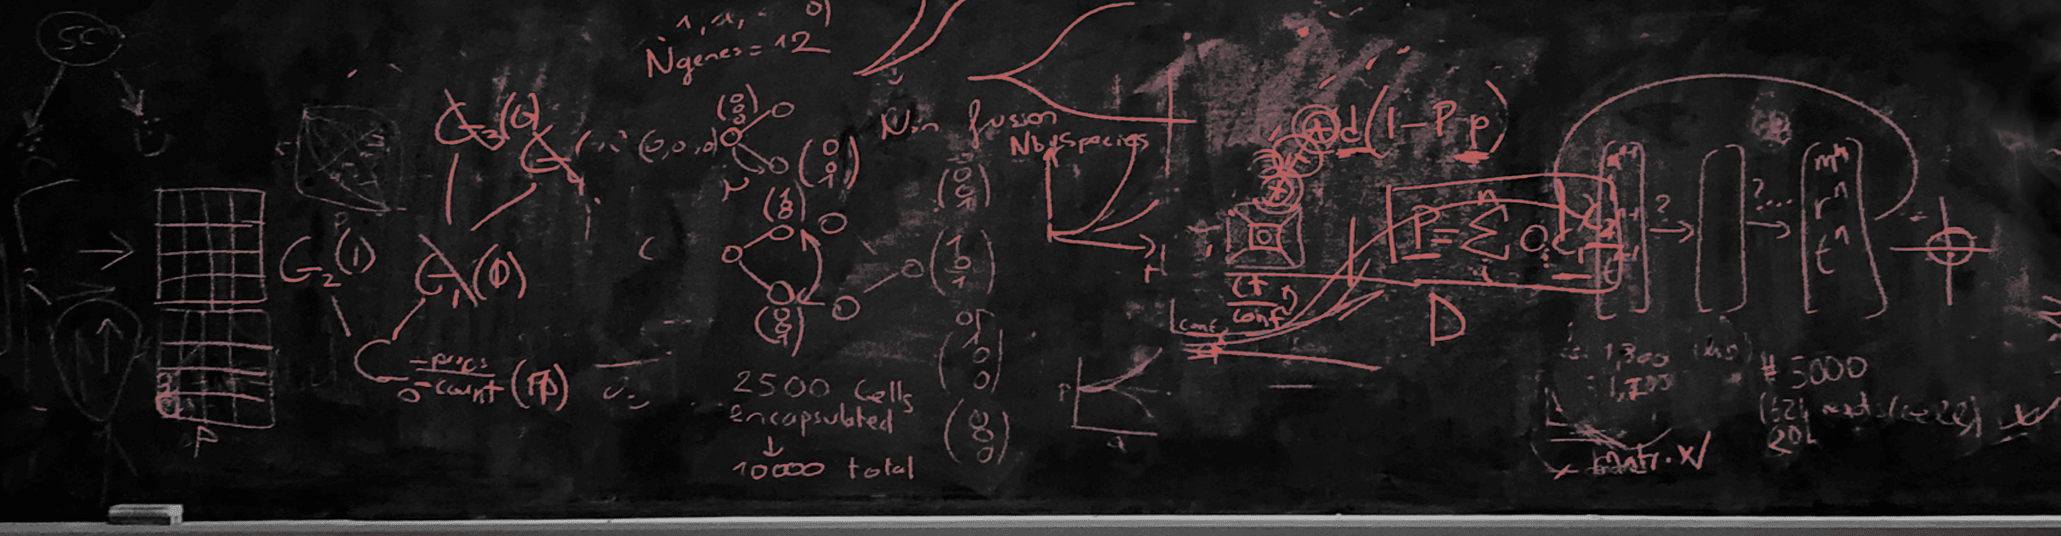
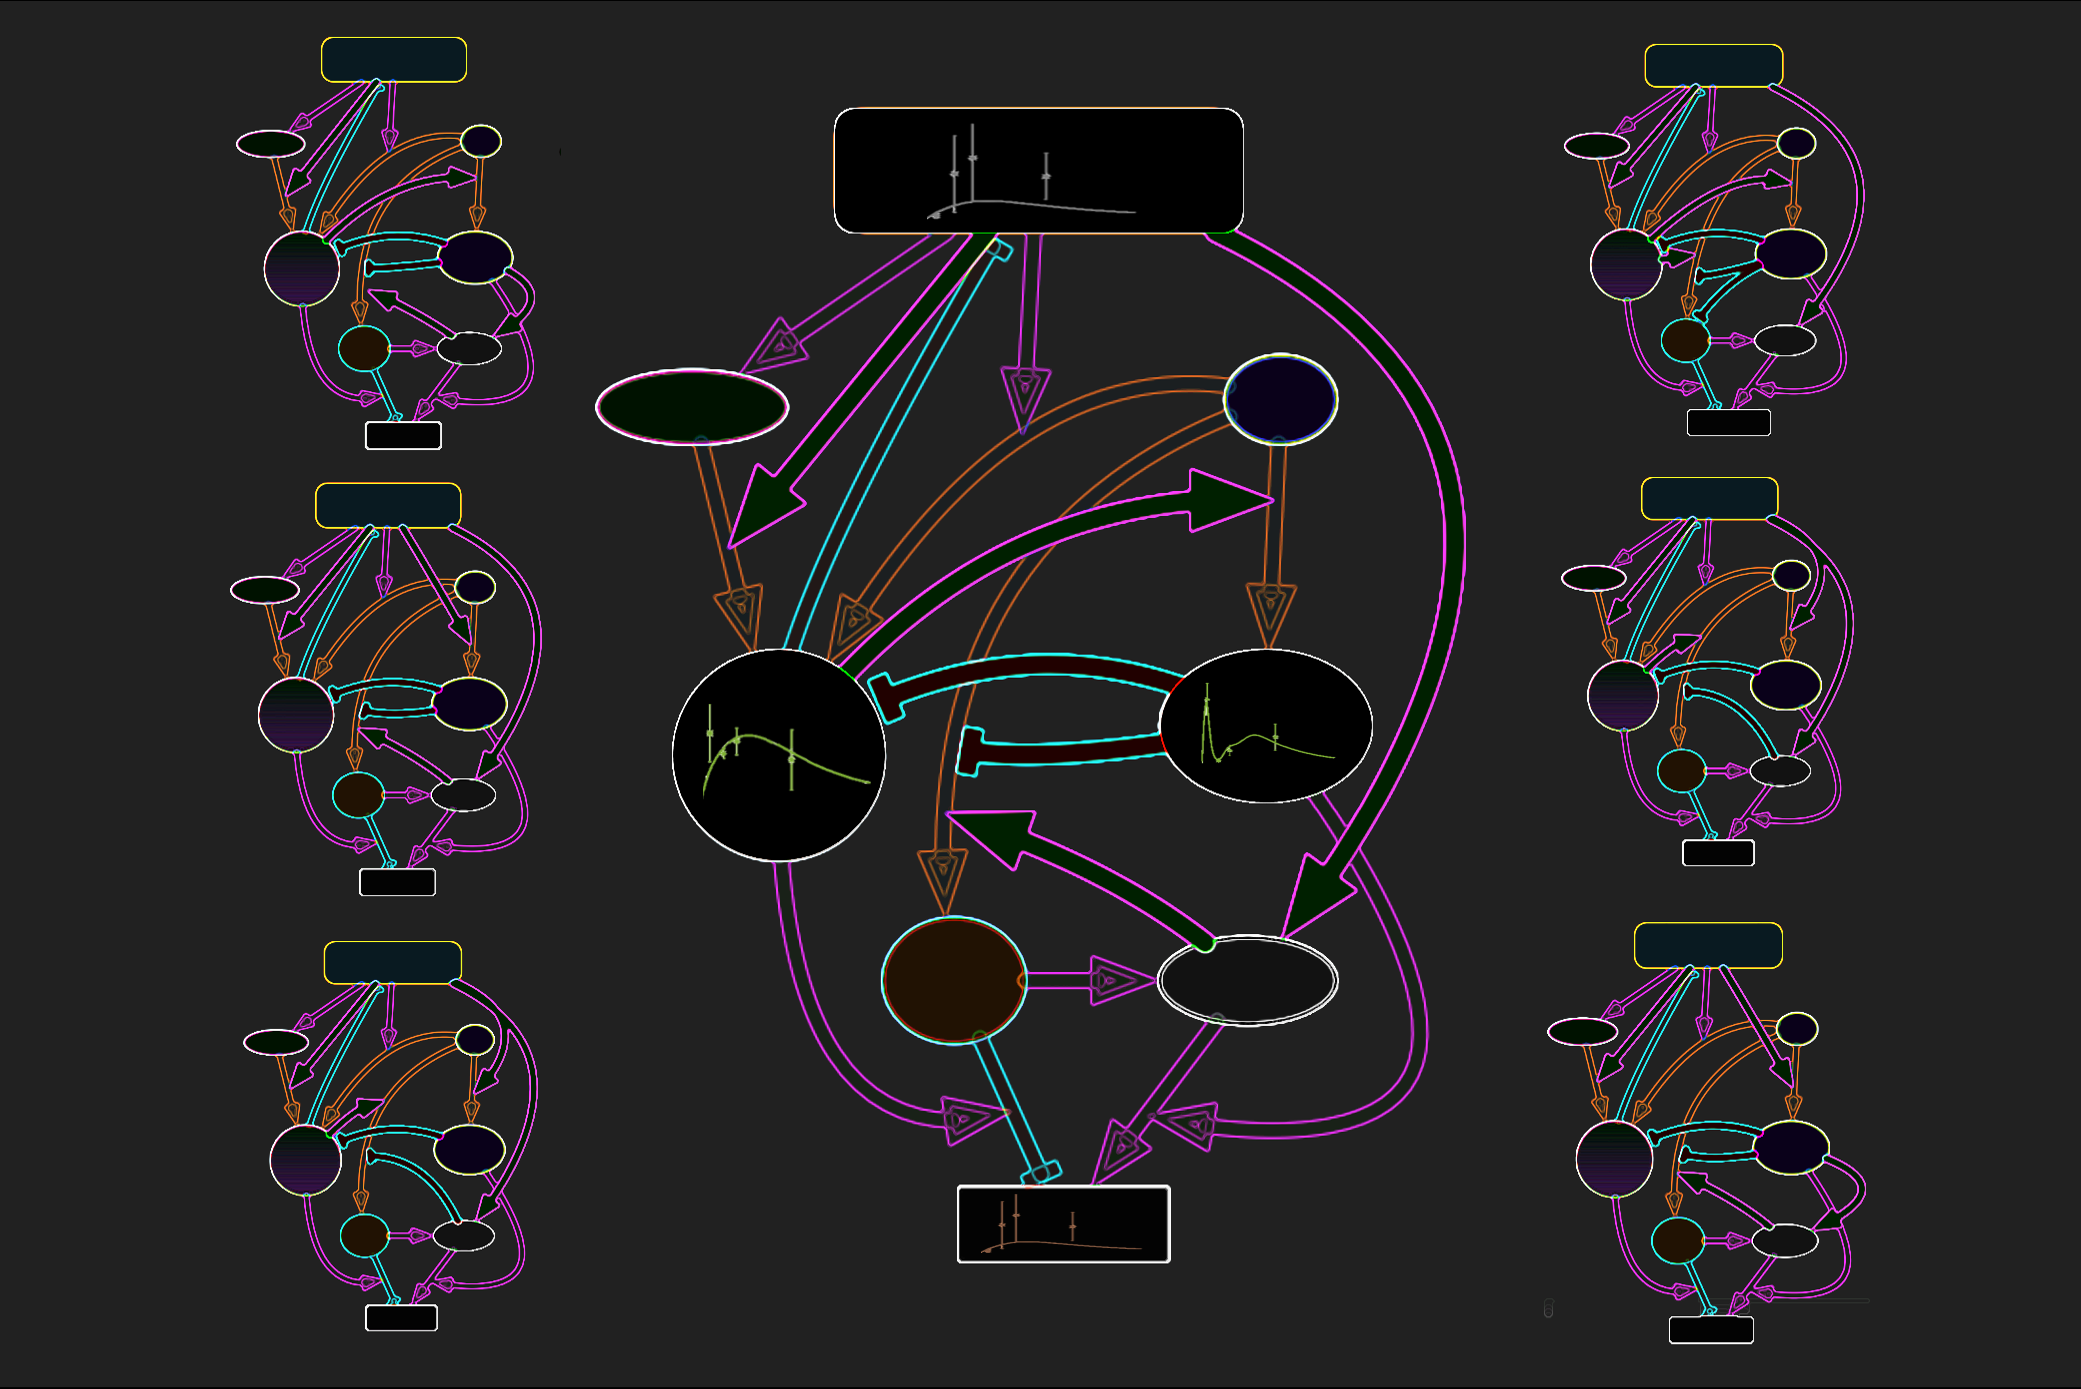
Issue 213: Hypothesis combination pipeline was built to identify mechanisms able to recapitulate bone injury data. Each node of the flow chart represents a cellular type, orange arrows represent state transition, purple arrows represent stimulation, and tile arrows represent inhibition. In total 18 hypotheses combination were tested against mouse bone injury data, comprising longitudinal quantification of bone cell populations. Each hypothesis combination was formalized by an ordinary-differential equation system, which goodness of fit was assessed and compared to other combinations. This way, one hypothesis combination pertaining to behaviour of osteoblasts, osteoclasts and macrophages was identified to the one recapitulating experimental data the best. Read the paper here.
© 2026 - The Mathematical Oncology Blog