
Click the image below to view the full size version of this
cover.
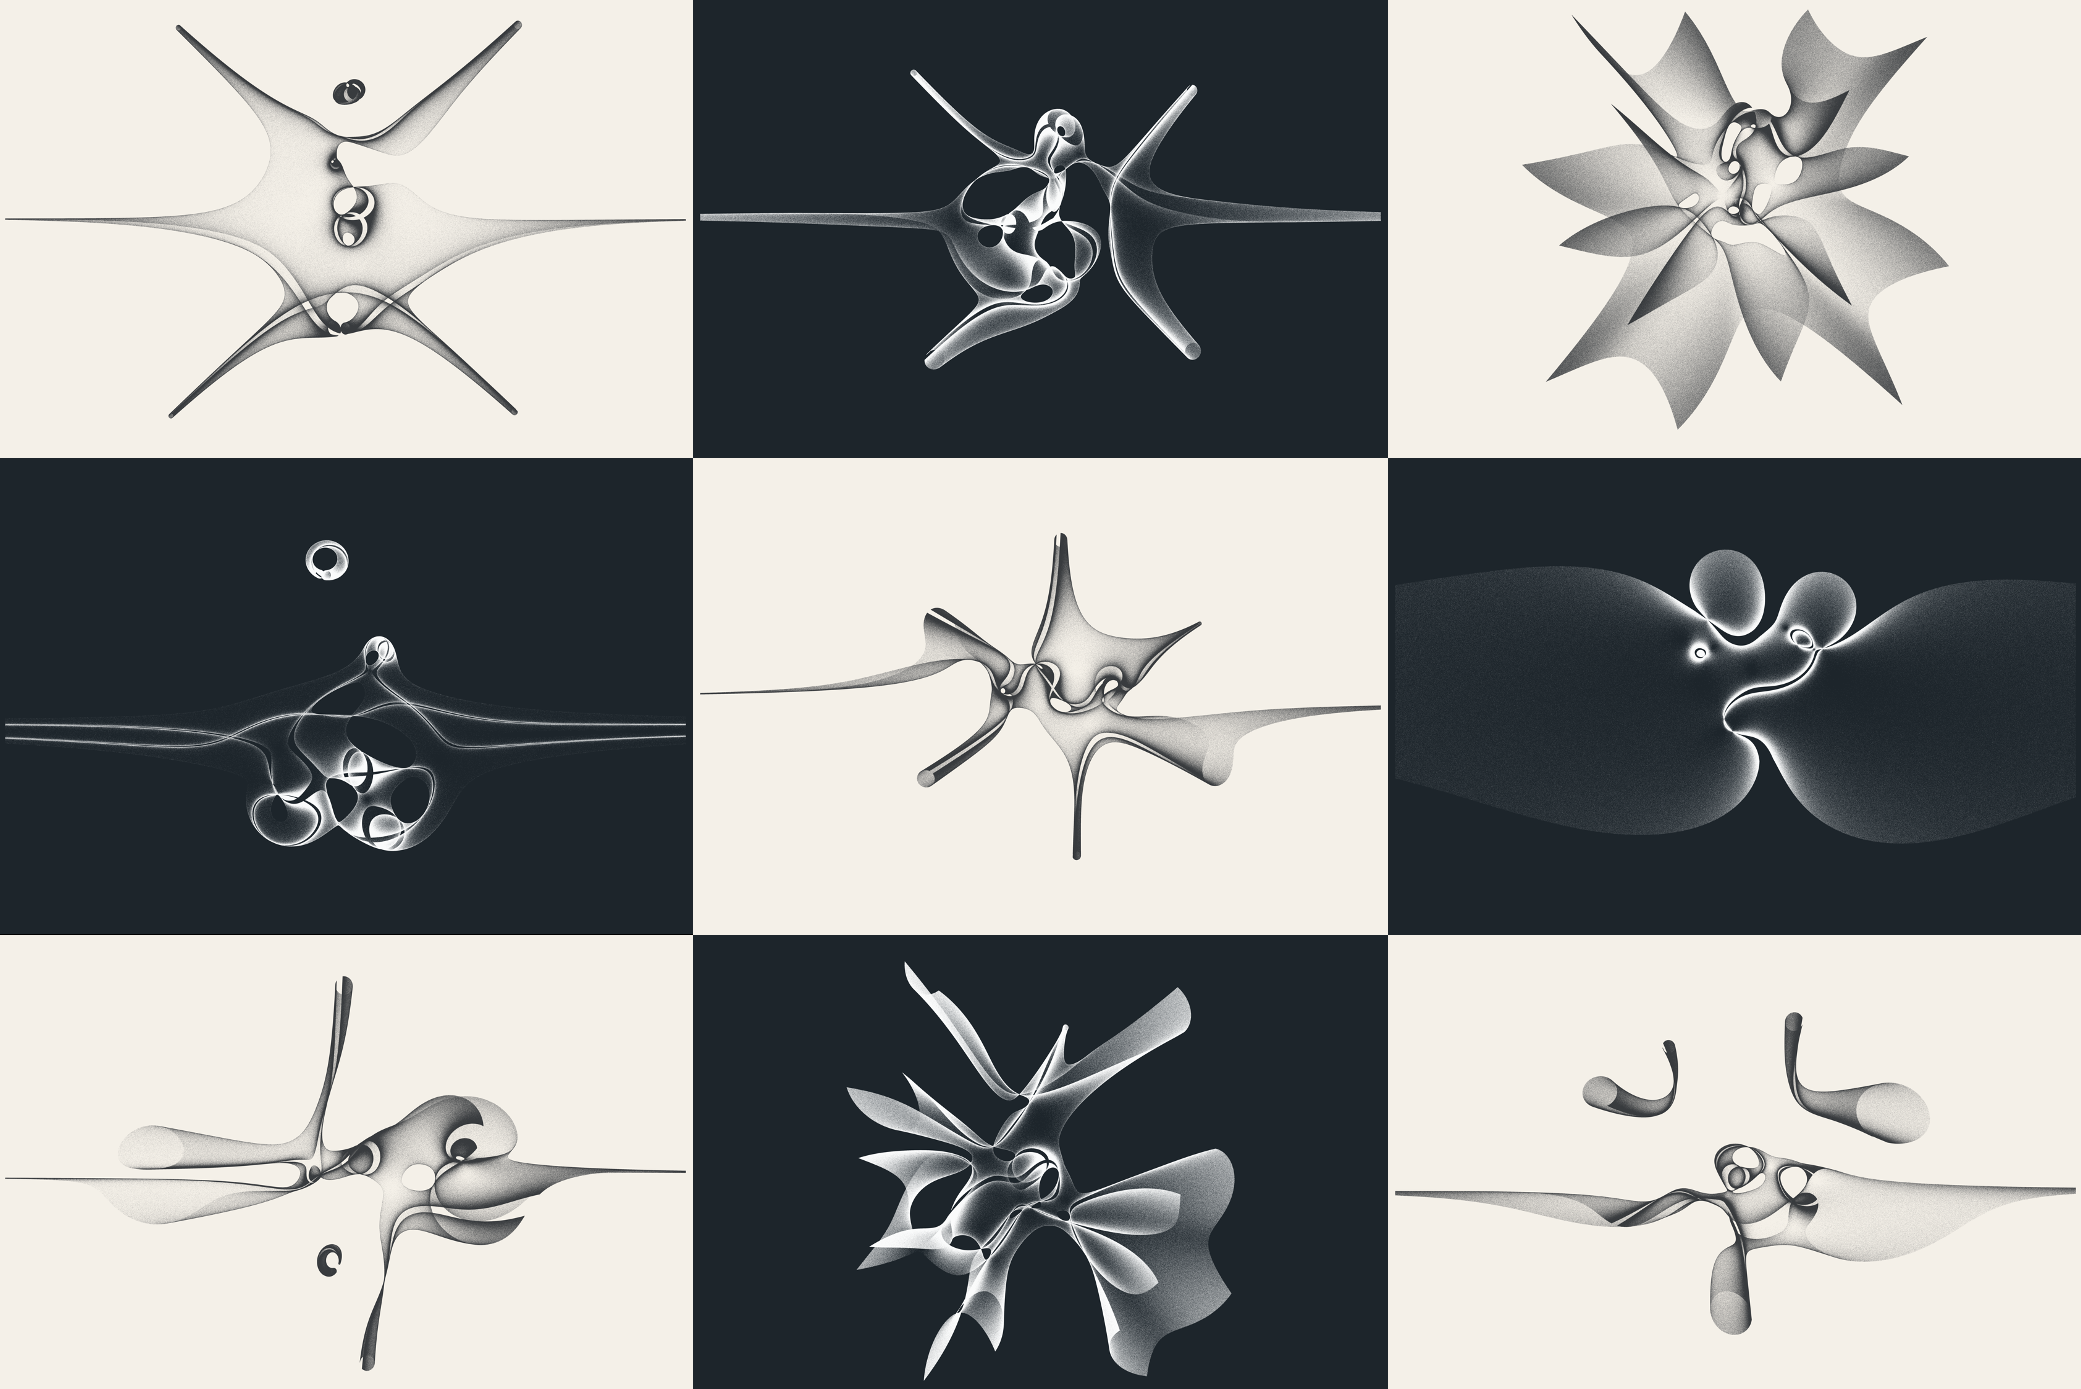
Created by: Simone Conradi
Issue 276: Each subplot illustrates the eigenvalues in ℂ for a family of 7 by 7 matrices. To generate a family, we first designate two entries t₁ and t₂ which we will vary, and then draw all other elements from the set {0, -i, i, 1, 0.5, 0.3}. These then remain fixed, while we sample 2,000,000 values t₁ and t₂, ranging from -20 to 20, compute that matrix’s eigenvalues, plot them in the complex plane, and repeat. To generate your own, you can find the code here.
© 2026 - The Mathematical Oncology Blog