HAL + EvoFreq
A tutorial on modeling & visualizing tumor evolution
EvoFreq: Visualization of the Evolutionary Frequencies of Sequence and Model Data
Chandler D. Gatenbee, Ryan O. Schenck, Rafael Bravo, Alexander R.A. Anderson
EvoFreq manuscript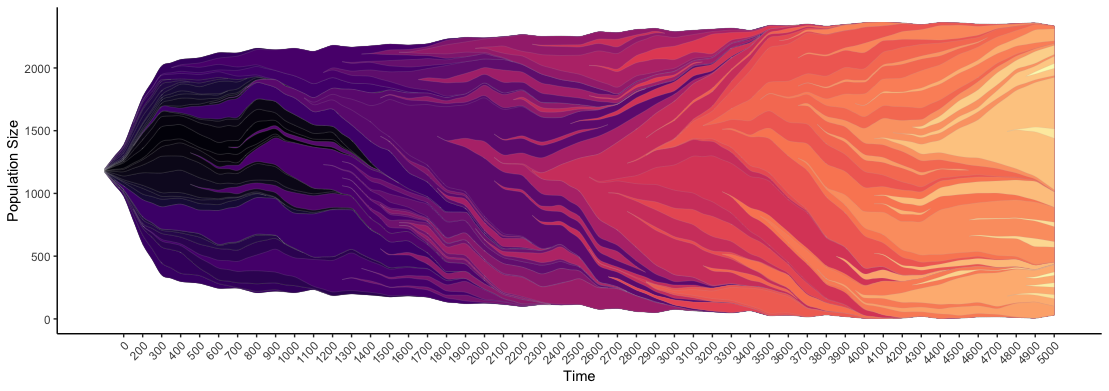 There has been an influx of publications using various modeling approaches to combine agent-based models (especially spatially-explicit models) with phylogenetic measurements. Recent examples include: quantification of spatial tumor sampling, the influence of tumor architecture, selection due to space, normal tissue turnover, and more.
The Anderson lab at Moffitt Cancer Center has developed HAL and EvoFreq in order to facilitate a straight-forward pipeline of modeling and visualizing simulated tumor evolution. HAL can be used to design an agent-based model and generate a clonal lineage tree. This lineage is automatically output in an EvoFreq-friendly format.
Download the HAL and EvoFreq code and follow along here.
In order to track lineages in HAL, all you need to do is 5 simple steps:
There has been an influx of publications using various modeling approaches to combine agent-based models (especially spatially-explicit models) with phylogenetic measurements. Recent examples include: quantification of spatial tumor sampling, the influence of tumor architecture, selection due to space, normal tissue turnover, and more.
The Anderson lab at Moffitt Cancer Center has developed HAL and EvoFreq in order to facilitate a straight-forward pipeline of modeling and visualizing simulated tumor evolution. HAL can be used to design an agent-based model and generate a clonal lineage tree. This lineage is automatically output in an EvoFreq-friendly format.
Download the HAL and EvoFreq code and follow along here.
In order to track lineages in HAL, all you need to do is 5 simple steps:
- Define the "Clone" class's initialization & attributes.
- Create a seed/ancestor clone.
- Increment Clone sizes during birth.
- Decrement Clone sizes during death.
- Create new clone after a mutation.
A simple birth-death model
The first thing you should notice in the repository is the "Model" folder, which has a simple birth-death agent-based model written in Java using the HAL framework. In order to run this code base, you'll need to download the latest version of Java and an editor (we suggest using IntelliJ Idea). Detailed instructions to set up HAL in IntelliJ are posted on the GitHub repository. In this simple birth-death process, each cell inherits the number of driver mutations and passenger mutations from its parent cell (mutations allowed). Cells divide faster with each subsequent driver mutation. Cells may also acquire (neutral) passenger mutations. Each clone is color-coded by the number driver mutations it inherits. Here's an example simulation:
Tumor Evolution Simulation:

class Clone extends Genome<Clone> {

    // clone-specific attributes
    int color; // clone-specific color, used in HAL and EvoFreq
    int kd; // number of driver mutations
    int kp; // number of passenger mutations

    public Clone(Clone parent, int kd, int kp) {
        super(parent, false);

        // set clone-specific attributes
        this.kd = kd;
        this.kp = kp;

        // choose color based on the num of drivers
        this.color = CategorialColor((kd - 1) % 19 );
    }
}// constructor from parameters
TumorEvolution(int sideLenth){
super(sideLenth,sideLenth, Cell.class,false,false);
// "seed" clone for common ancestry (non-existent in simulation)
clone0 = new Clone(null,1,0);
// construct original tumor
for (int x = 0; x < r0; x++) {
for (int y = 0; y < r0; y++) {
// initialize all new cells w/ 1 driver & 0 passengers
Clone newClone = new Clone(clone0,1,0);
NewAgentSQ(x + xDim/2 - r0 / 2,y + yDim/2 - r0 / 2).Init(newClone);
}
}
}Recording clonal populations over time
Inside the main function of our HAL code is a "for" loop which iterates the birth-death process for each cell (this is inside the "Step()" function). Every few time steps I save another frame of the simulation into a GIF, and I save the clonal populations by calling the "RecordClones()" function:for (int time = 0; time <= totalTime; time++) {
tumor.Step(); // birth & death for all cells
if (time % modifier == 0) {
DrawCellsAndSaveGif(tumor, window, myGif);
// record clonal pops
tumor.clone0.RecordClones(time); // iterate through all clones & record population sizes
}
}Updating clonal lineage during birth & death
If a mutation has occurred, we need to update several pieces of information. First, we decrement the population of the original clone (DecPop). Next, we create a new Clone with self as the parent, indicating the number of drivers & passengers. Lastly, we increment the population of the newest clone (IncPop).// mutation has occured
this.clone.DecPop();
this.clone = new Clone(this.clone,new_kd,new_kp);
this.clone.IncPop();Please note that IncPop is also called every time a cell is initialized (the "Init()" function in Cell.java) and DecPop is called every time a cell dies (the "Death()" function in Cell.java).
At the end of the main() function, the clonal lineage tree is output in a convenient format for EvoFreq. The following lines facilitate this:
// save clonal information in EvoFreq format:
String[] AttributesList = new String[]{"Drivers","Passengers","Color"};
tumor.clone0.OutputClonesToCSV(foldername+"phylogeny_tracker.csv",AttributesList, (Clone c) -> {return GetAttributes(c); },tumor.delete_threshold);
The "OutputClonesToCSV()" function is where the tree is built and recorded. This function is a member of the "Clone" class, meaning it will build a tree from an arbitrary ancestor clone, but here we want the full tumor history so we call it on "clone0," the original initialization clone seed. We can also output some clone-specific attributes, which may be useful later. In fact, we can output the same clone-specific color used to visualize in HAL, so that our Muller plots match our color scheme! We need to read in a String array of clonal attribute names, plus an inline function to generate the attributes (reads in a clone, outputs an array of attributes). To do so, I'm calling "GetAttributes()." We also ignore any clones that never reach above a threshold value. The output will look something like this:
Drivers  Passengers   Color     ClonalID  ParentID    0     50     100     150     200
1        0            #3874b1   1         0           400   1163   2469    4260    6525
1        1            #3874b1   1         1           0     0      15      31      81
1        2            #3874b1   1         2           0     0      0       16      24
2        3            #4f9f39   2         2           0     0      11      21      31
... etcRead in EvoFreq
After running this example in HAL, there should be a file in the "data-output" folder called "phylogeny_tracker.csv." This is the file we will read into EvoFreq. Since EvoFreq is an R package, you'll need to open the "using_evo_freq.R" script in RStudio (or something similar). Here's the script:## to install EvoFreq:
install.packages('devtools')
library(devtools)
install_github('MathOnco/EvoFreq')
mypath <- "~/Documents/GitHub/tumor-evolution-HAL/data-output/phylogeny_tracker.csv"
hal_info <- read.HAL(mypath)
print(hal_info$evofreq_plot)The first few lines install EvoFreq. Next you'll use the function "read.HAL" and pass in the correct directory where you CSV is stored. EvoFreq can plot a variety of formats including Muller plots, dendrograms, and even videos. With this line, "fill_value = hal_info\$attributes\$Color", I ensure that my color scheme is identical to HAL's color scheme for coloring clones. See below:
# color by the same color scheme as HAL
hal_info <- read.HAL(mypath,fill_name = "Color")
print(hal_info$evofreq_plot)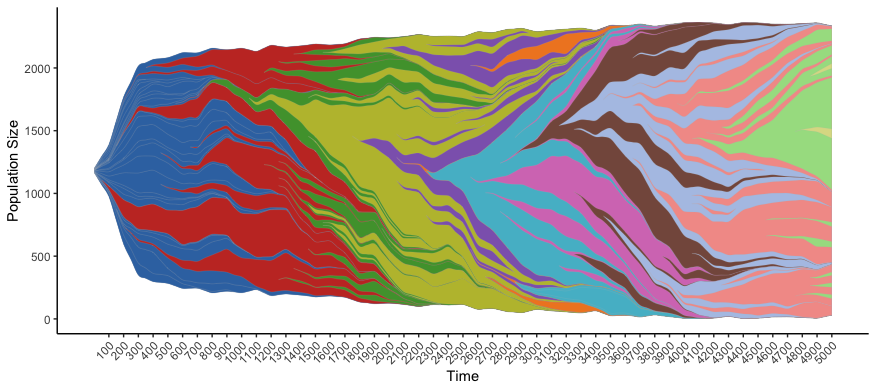 To adapt this code to suit your own purposes, you'll need to re-write the Clone class to include all the clonal-specific attributes you desire. Next, you'll implement the birth-death scheme that you want, paying close attention to when you need to increment and decrement clonal populations. Lastly, you'll call "RecordClones" at each timestep, in order to save the information over time. To output in an EvoFreq friendly format, call the "PopRecordToCSV" function, and use "read.HAL" in EvoFreq. Again, the link to download all the code used in this post is here.
While here we focus on EvoFreq's use integrated within a modeling framework, it's also fully capable of handling data output from common subclonal reconstruction software such as CALDER, PhyloWGS, and ClonEvol. EvoFreq is also a great tool for visualizing evolutionary studies where barcoding methodologies are employed to track populations over time. Read more in the preprint, here.
To adapt this code to suit your own purposes, you'll need to re-write the Clone class to include all the clonal-specific attributes you desire. Next, you'll implement the birth-death scheme that you want, paying close attention to when you need to increment and decrement clonal populations. Lastly, you'll call "RecordClones" at each timestep, in order to save the information over time. To output in an EvoFreq friendly format, call the "PopRecordToCSV" function, and use "read.HAL" in EvoFreq. Again, the link to download all the code used in this post is here.
While here we focus on EvoFreq's use integrated within a modeling framework, it's also fully capable of handling data output from common subclonal reconstruction software such as CALDER, PhyloWGS, and ClonEvol. EvoFreq is also a great tool for visualizing evolutionary studies where barcoding methodologies are employed to track populations over time. Read more in the preprint, here.
© 2026 - The Mathematical Oncology Blog