Long-term quantitation and modeling of cell dynamical responses to in vitro chemotherapy schedules
Behind the Paper
Quantification of long-term doxorubicin response dynamics in breast cancer cell lines to direct treatment schedules
Grant R. Howard, Tyler A. Jost, Thomas E. Yankeelov, Amy Brock
Read the paper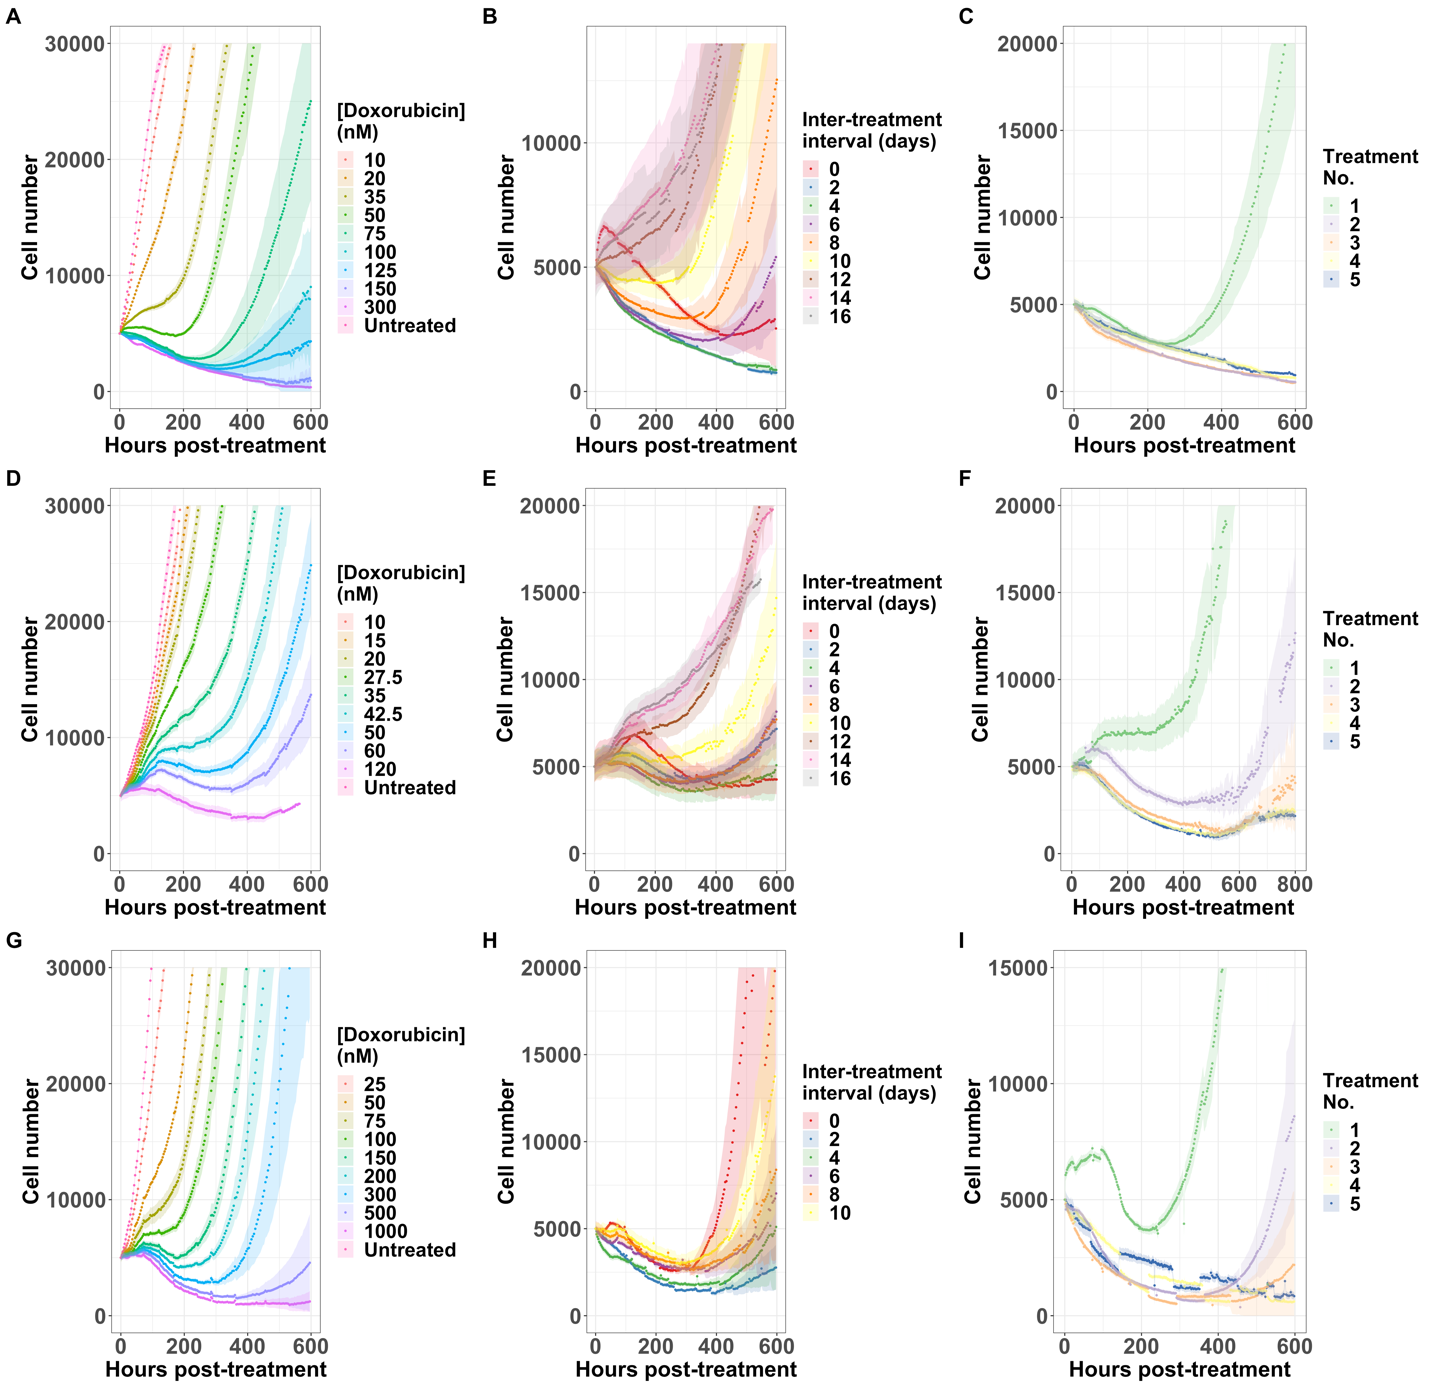
Figure 1: Cell growth over time in response to varying doxorubicin regimens. The first row is the response of the MCF7 cell line, the second is the response of the BT474 cell line, and the third is the MDA-MB-231 cell line. The first column varies the concentration of drug, the second the inter-treatment interval, and the third the consecutive number of treatments. Each curve is the average of six (A,D, G) or 12 (B, C, E, F, H, I) replicates.
To better interpret cell proliferation and death data, we evaluated a family of phenomenological models that were fit to the data. In the model selection process, we determined that two modifications to a biexponential model were necessary to fit the model to ground-truth data. First, we observed that sensitive cells may remain quiescent for days to weeks after drug treatment before eventually dying. Models with an exponential delay in death rate of sensitive cells best described this observation. Second, we noted a delay in the proliferation of resistant cells after doxorubicin washout. In model identifiability studies, we found that the resistant cell growth delay and the resistant cell fraction are not computationally separable, therefore this delay must be determined experimentally for each set of cells and treatment conditions. To measure the proliferation delay, we developed a computational pipeline which used density-based clustering to identify the time at which patches of cells begin to regrow after treatment. With these additions to the model, we found that the inter-treatment interval, or the time between treatments, was an optimizable factor (Figure 2). For example, MCF7 cells treated with 2 doses of 75 nM doxorubicin separated by an interval of 2 days showed significantly longer time to re-growth than cells treated at intervals of 4 or 10 days, and significantly longer than a single dose of 150 nM doxorubicin. Furthermore, under some treatment regimens, we observed a bifurcation in the cell population response: some replicate cultures recover proliferative capacity during the experiment, while others do not. In these cases, retreatment during the window of transient sensitivity increased elimination of the cancer cell population.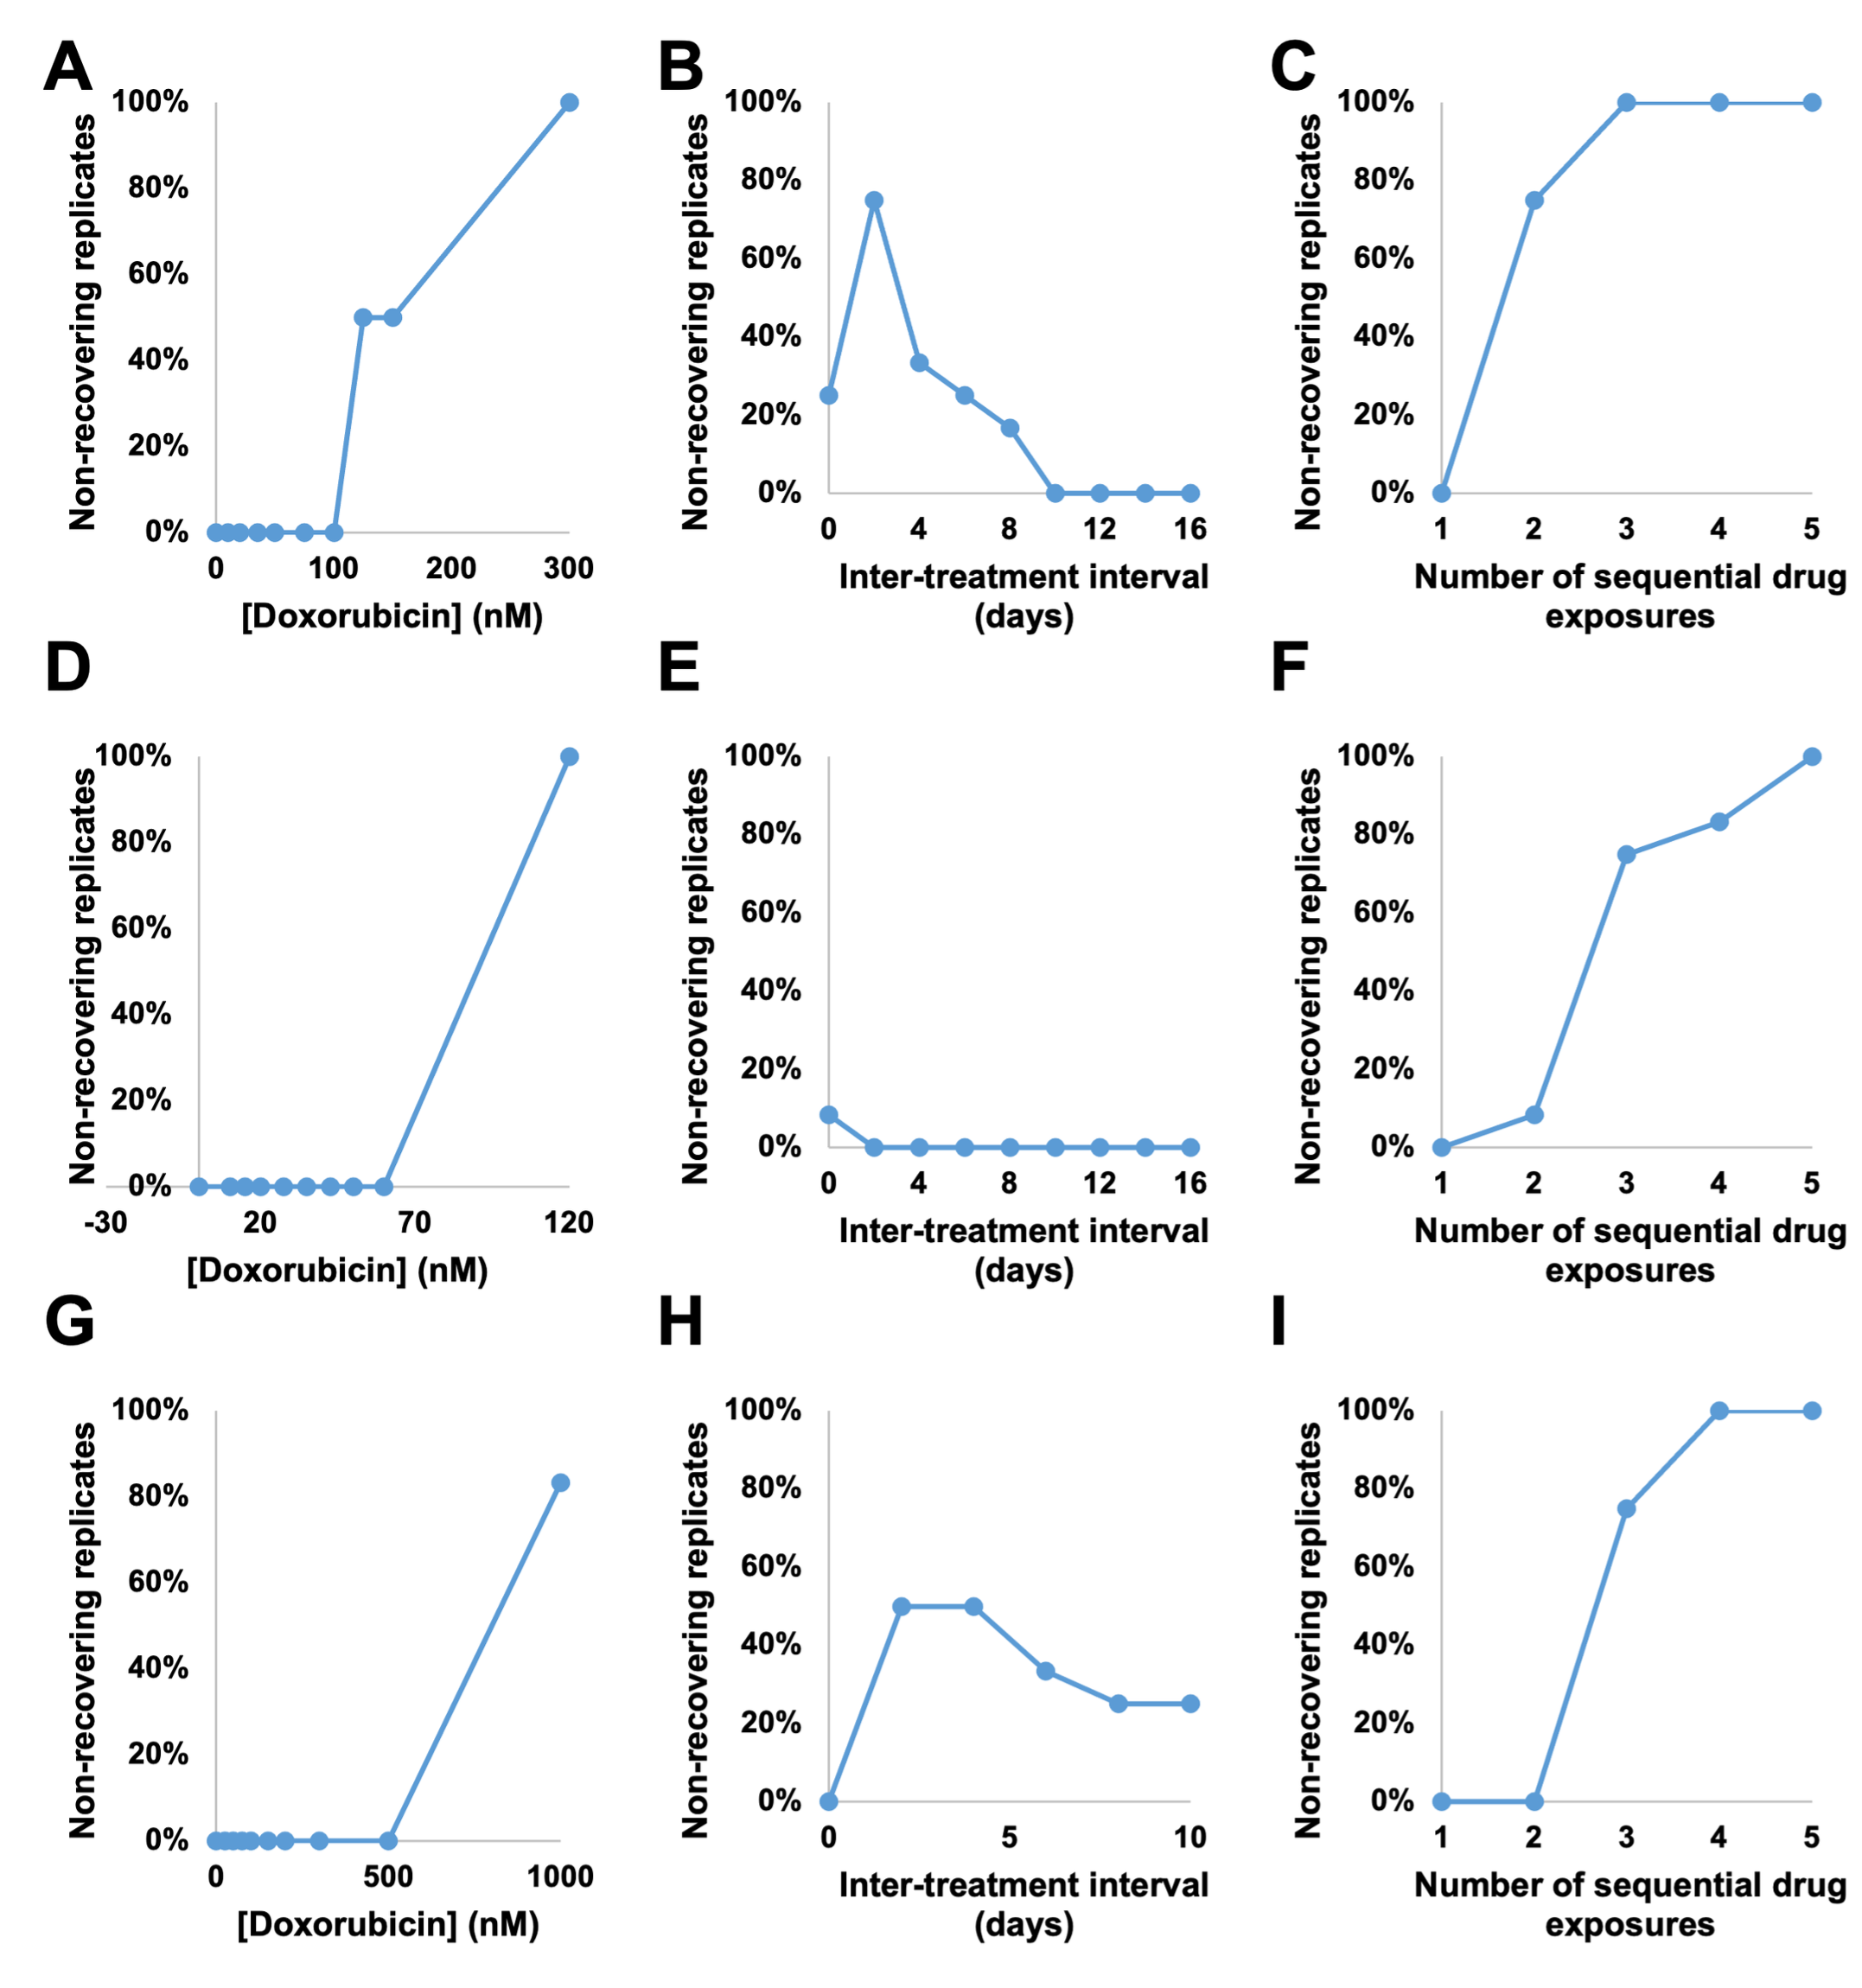
Figure 2: The proportion of non-recovering replicates in response to varying doxorubicin regimens. The first row is the percentage of non-recovering replicates from the MCF7 cell line, the second from the BT474 cell line, and the third from the MDA-MB-231 cell line. The first column varies the concentration of drug, the second the inter-treatment interval, and the third the consecutive number of treatments. As expected, increasing concentration of drug and number of exposures increases the number of non-recovering replicates. However, inter-treatment interval also proved to be an optimizable factor in the MCF7 and MDA-MB-231 cell lines.
Taken together, these studies indicate that the processes of cell death, cell cycle arrest, and resistant cell proliferation after chemotherapy treatment are complex and their time scales may overlap. In vitro studies and preclinical screening often report cell death at a single end-point 24–72 hours after treatment; this is insufficient to quantify the long-term drug response of the heterogeneous cell population. Longitudinal studies such as this one, implemented iteratively to identify key time scales that include inter-treatment interval, may enable further optimization of drug treatment schedules to better inform preclinical testing.References
- Retsky M. (2011) Metronomic Chemotherapy was Originally Designed and first used in 1994 for Early Stage Cancer - why is it Taking so Long to Proceed? J Bioequiv Availab 3: 00i-0iv. doi:10.4172/jbb.100000e6
- Emmenegger U, Kerbel RS (2007) Five years of clinical experience with metronomic chemotherapy: achievements and perspectives. Onkologie 30: 606-608.
- West J., Newton P.K. Chemotherapeutic dose scheduling based on tumor growth rates provides a case for low-dose metronomic high-entropy therapies. Cancer Res. 2017;77:6717–6728. doi: 10.1158/0008-5472.CAN-17-1120.
- Gatenby R., Silva A., Gillies R., Frieden B. Adaptive therapy. Cancer Res. 2009;69:4894–4903. doi: 10.1158/0008-5472.CAN-08-3658.
- Brady-Nicholls, R., Zhang, J., Zhang, T., Wang, A. Z., Butler, R., Gatenby, R. A., & Enderling, H. (2021). Predicting patient-specific response to adaptive therapy in metastatic castration-resistant prostate cancer using prostate-specific antigen dynamics. Neoplasia, 23(9), 851-858.
- West, J., You, L., Zhang, J., Gatenby, R. A., Brown, J. S., Newton, P. K., & Anderson, A. R. (2020). Towards multidrug adaptive therapy. Cancer research, 80(7), 1578-1589.
- Howard GR, Jost TA, Yankeelov TE, Brock A (2022) Quantification of long-term doxorubicin response dynamics in breast cancer cell lines to direct treatment schedules. PLoS Comput Biol 18(3): e1009104. https://doi.org/10.1371/journal.pcbi.1009104
© 2026 - The Mathematical Oncology Blog