Mathematical Oncology

Mistic, an open-source multiplexed image t-SNE

Behind the paper

Written by Sandhya Prabhakaran - October 18, 2021


Mistic, an open-source multiplexed image t-SNE

Sandhya Prabhakaran, Chandler Gatenbee, Mark Robertson-Tessi, Jeffrey West, Amer A. Beg, Jhanelle Gray, Scott Antonia, Robert A. Gatenby, Alexander R. A. Anderson

Read the preprint


I have always been intrigued by images and the stories they can tell. The computational analysis of high-dimensional images to extract stories is a challenging task. My first computer vision classes were during my Masters in Robotics from the University of Edinburgh with Dr. Bob Fisher. Working through Dr. Fisher’s diverse assignments that consisted of creating a panorama from overlapping images, predicting obscured objects and coding an infrared vision sensor, the emphasis was always on image pre-processing, being a crucial component (if not, the most important) that determined the downstream image analysis and results.

I encountered the same challenge of image pre-processing while analyzing the 92 multiplexed image dataset obtained from a NSCLC immunotherapy trial from Moffitt Cancer Center. We were interested in understanding if and how treatment changed the tumor patterns across patients, and whether these patterns were predictive of patient response. As part of image pre-processing that involved cleaning and segmenting these images, we were also keen in arranging the images in a specific manner to visually bring out underlying patterns that would otherwise have been hard to detect.

This was the motivation and need to develop Mistic, which is an open-source image t-SNE viewer for simultaneous viewing of multiple multiplexed 2D images using predefined coordinates (e.g. t-SNE or UMAP), randomly generated coordinates, or as vertical grids. Currently there exists no software that enables users to view multiple multiplexed images at once. Multiplexed images are used to understand the complex tumor ecology and the spatio-temporal relationships within the tumor microenvironment. Visualizing all the images simultaneously, through an image t-SNE, using multiple layout options will facilitate getting preliminary insights into these vast high-dimensional images.

figure

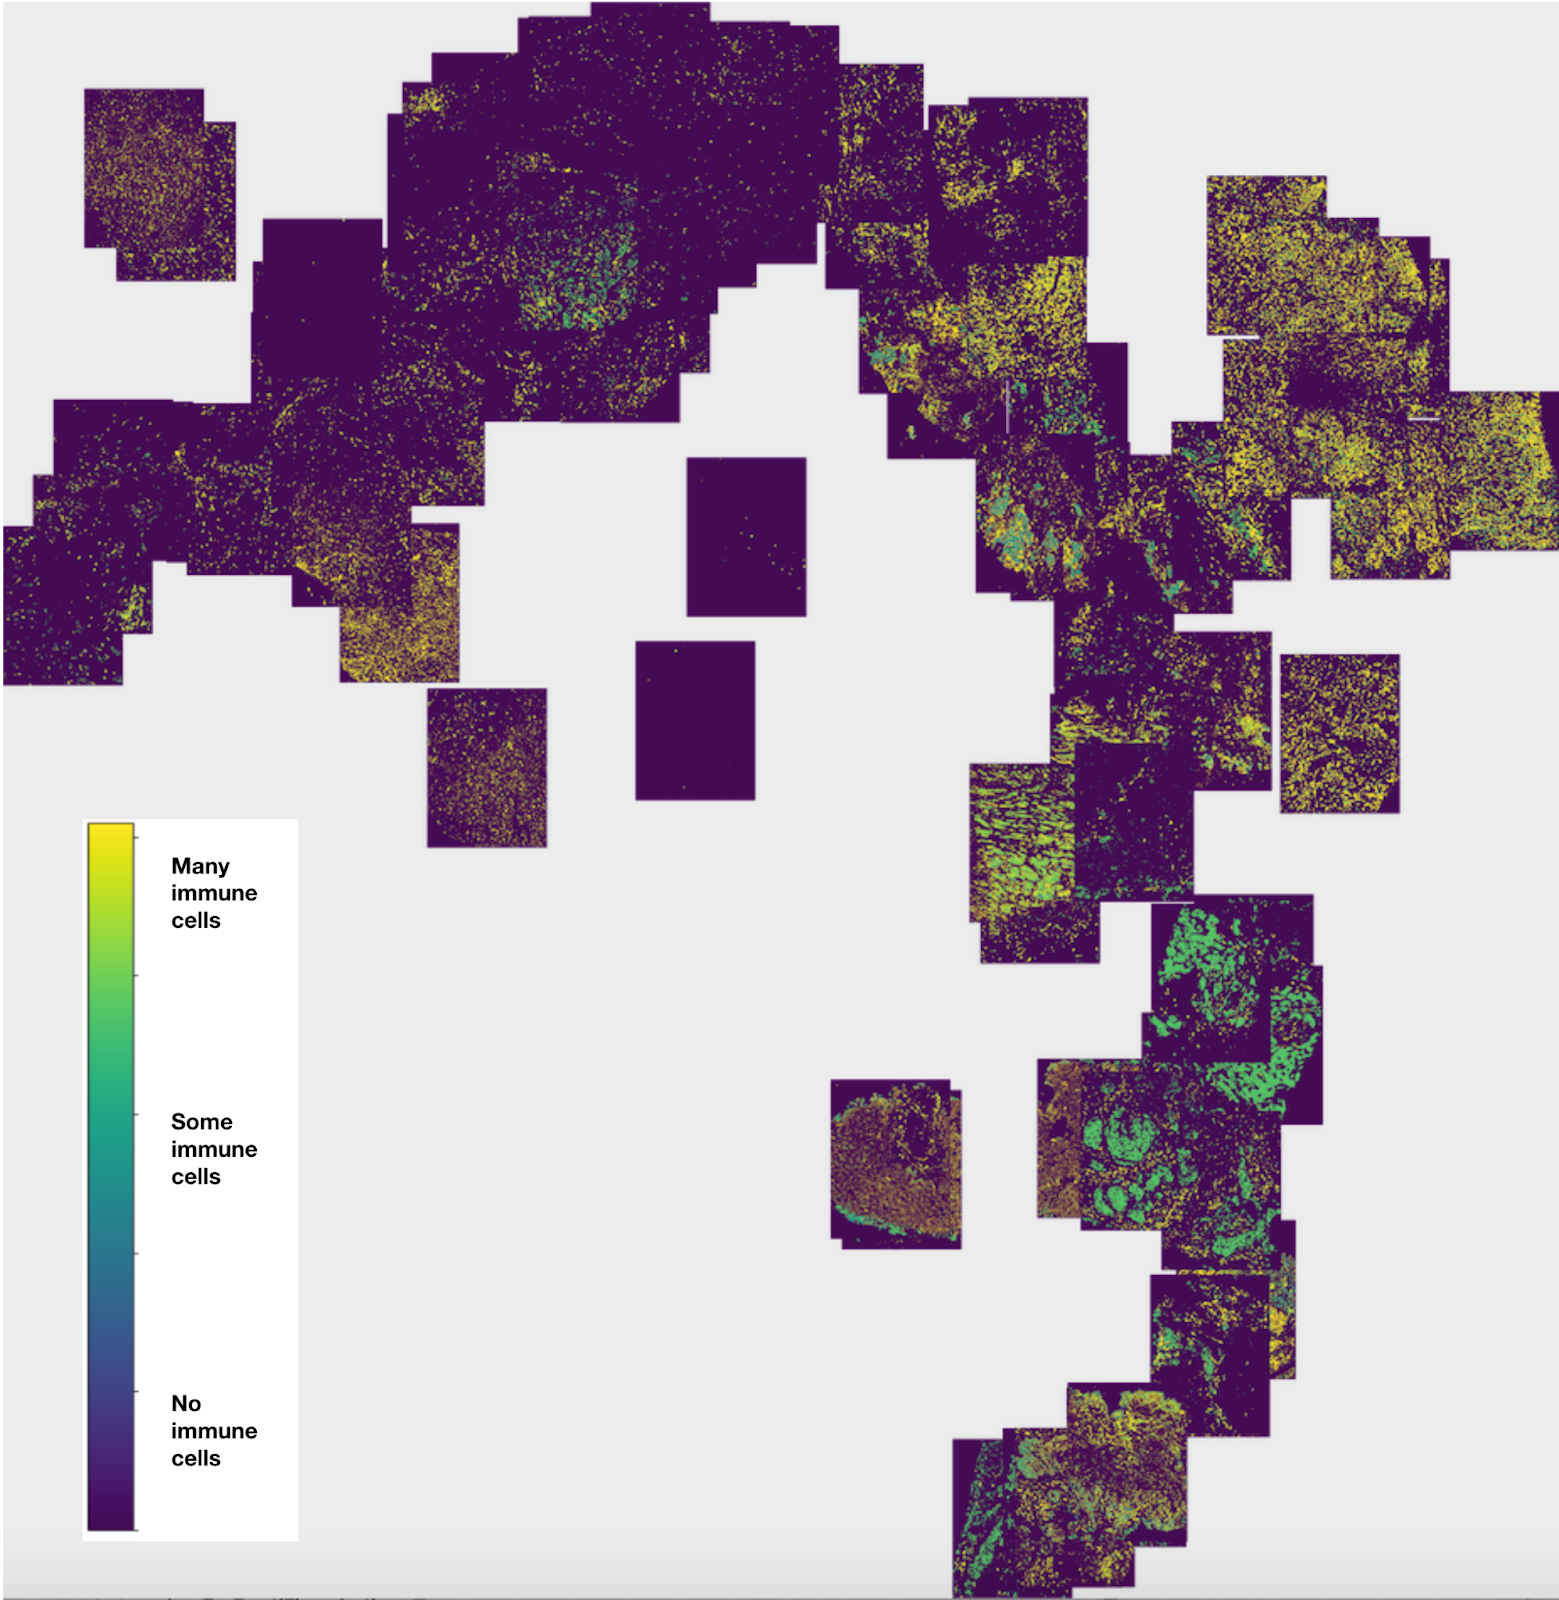
Figure 1: Image t-SNE showing immune cell gradient across multiple multiplexed images

We developed Mistic that generates such an image t-SNE. Mistic’s GUI is shown in Figure 2. Mistic generates thumbnails for images based on user preferences and arranges them in different layouts: (left) user-predefined coordinates (e.g. from t-SNE or UMAP analysis), (middle) using a grid layout, or (right) random coordinates (Figure 3).

figure

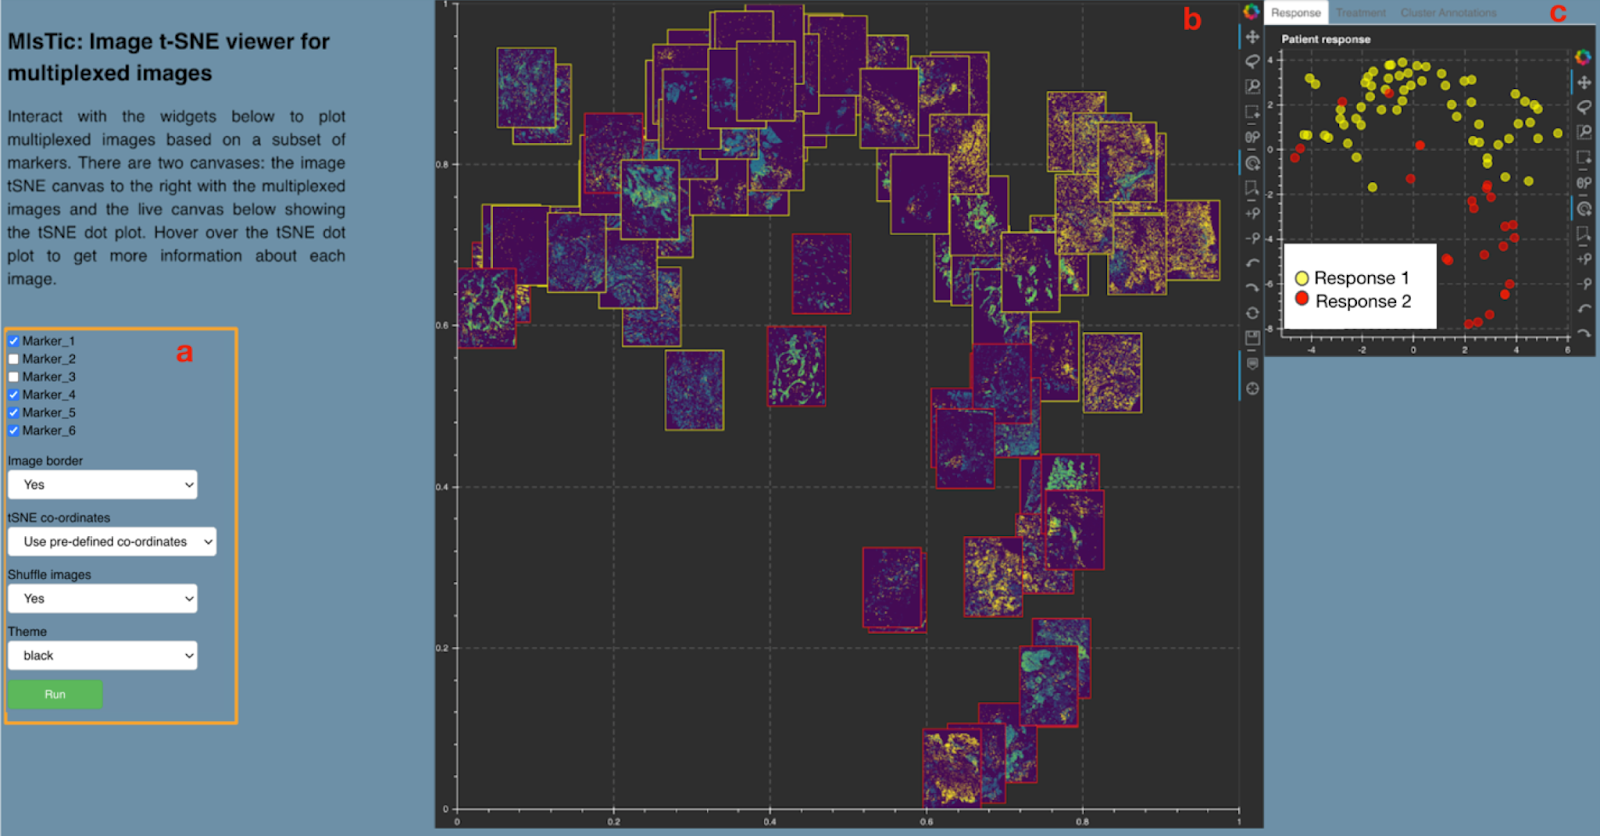
Figure 2: Mistic GUI: a. User-input panel where markers can be selected, new or pre-defined image display coordinates can be chosen, etc. b. Static canvas showing the image t-SNE colored and arranged as per user inputs. c. Live canvas showing the corresponding t-SNE scatter colored based on metadata.

figure

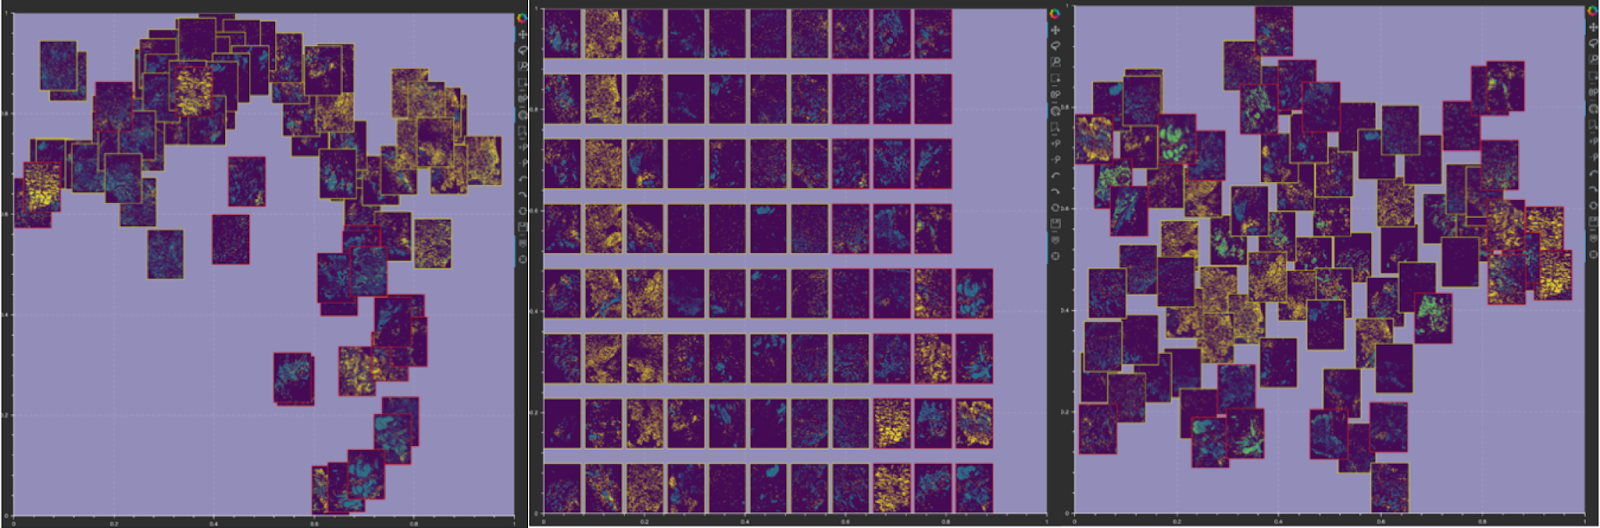
Figure 3: Image layout in Mistic’s static canvas: (i) based on user-defined t-SNE coordinates (left); (ii) vertical rows (center); (iii) randomly placed (right).

We tested Mistic on multiplexed images from Perkinelmer Vectra. Mistic also allows metadata of the multiplexed images to be displayed. Currently there is no freely available tool to generate such image t-SNEs. Mistic is developed using Bokeh and Python, and can be downloaded directly from the IMO GitHub pages at: https://github.com/MathOnco/Mistic. A preprint with further details on how to use Mistic is available on BioRxiv here.

Future work involves experimenting Mistic with higher dimensional images and images generated using different technologies.
← Previous Post Next Post