Click the image below to view the full size version of this cover.
Created by: Maximilian Strobl, Jeffrey West, Ryan Schenck, Sandy Anderson
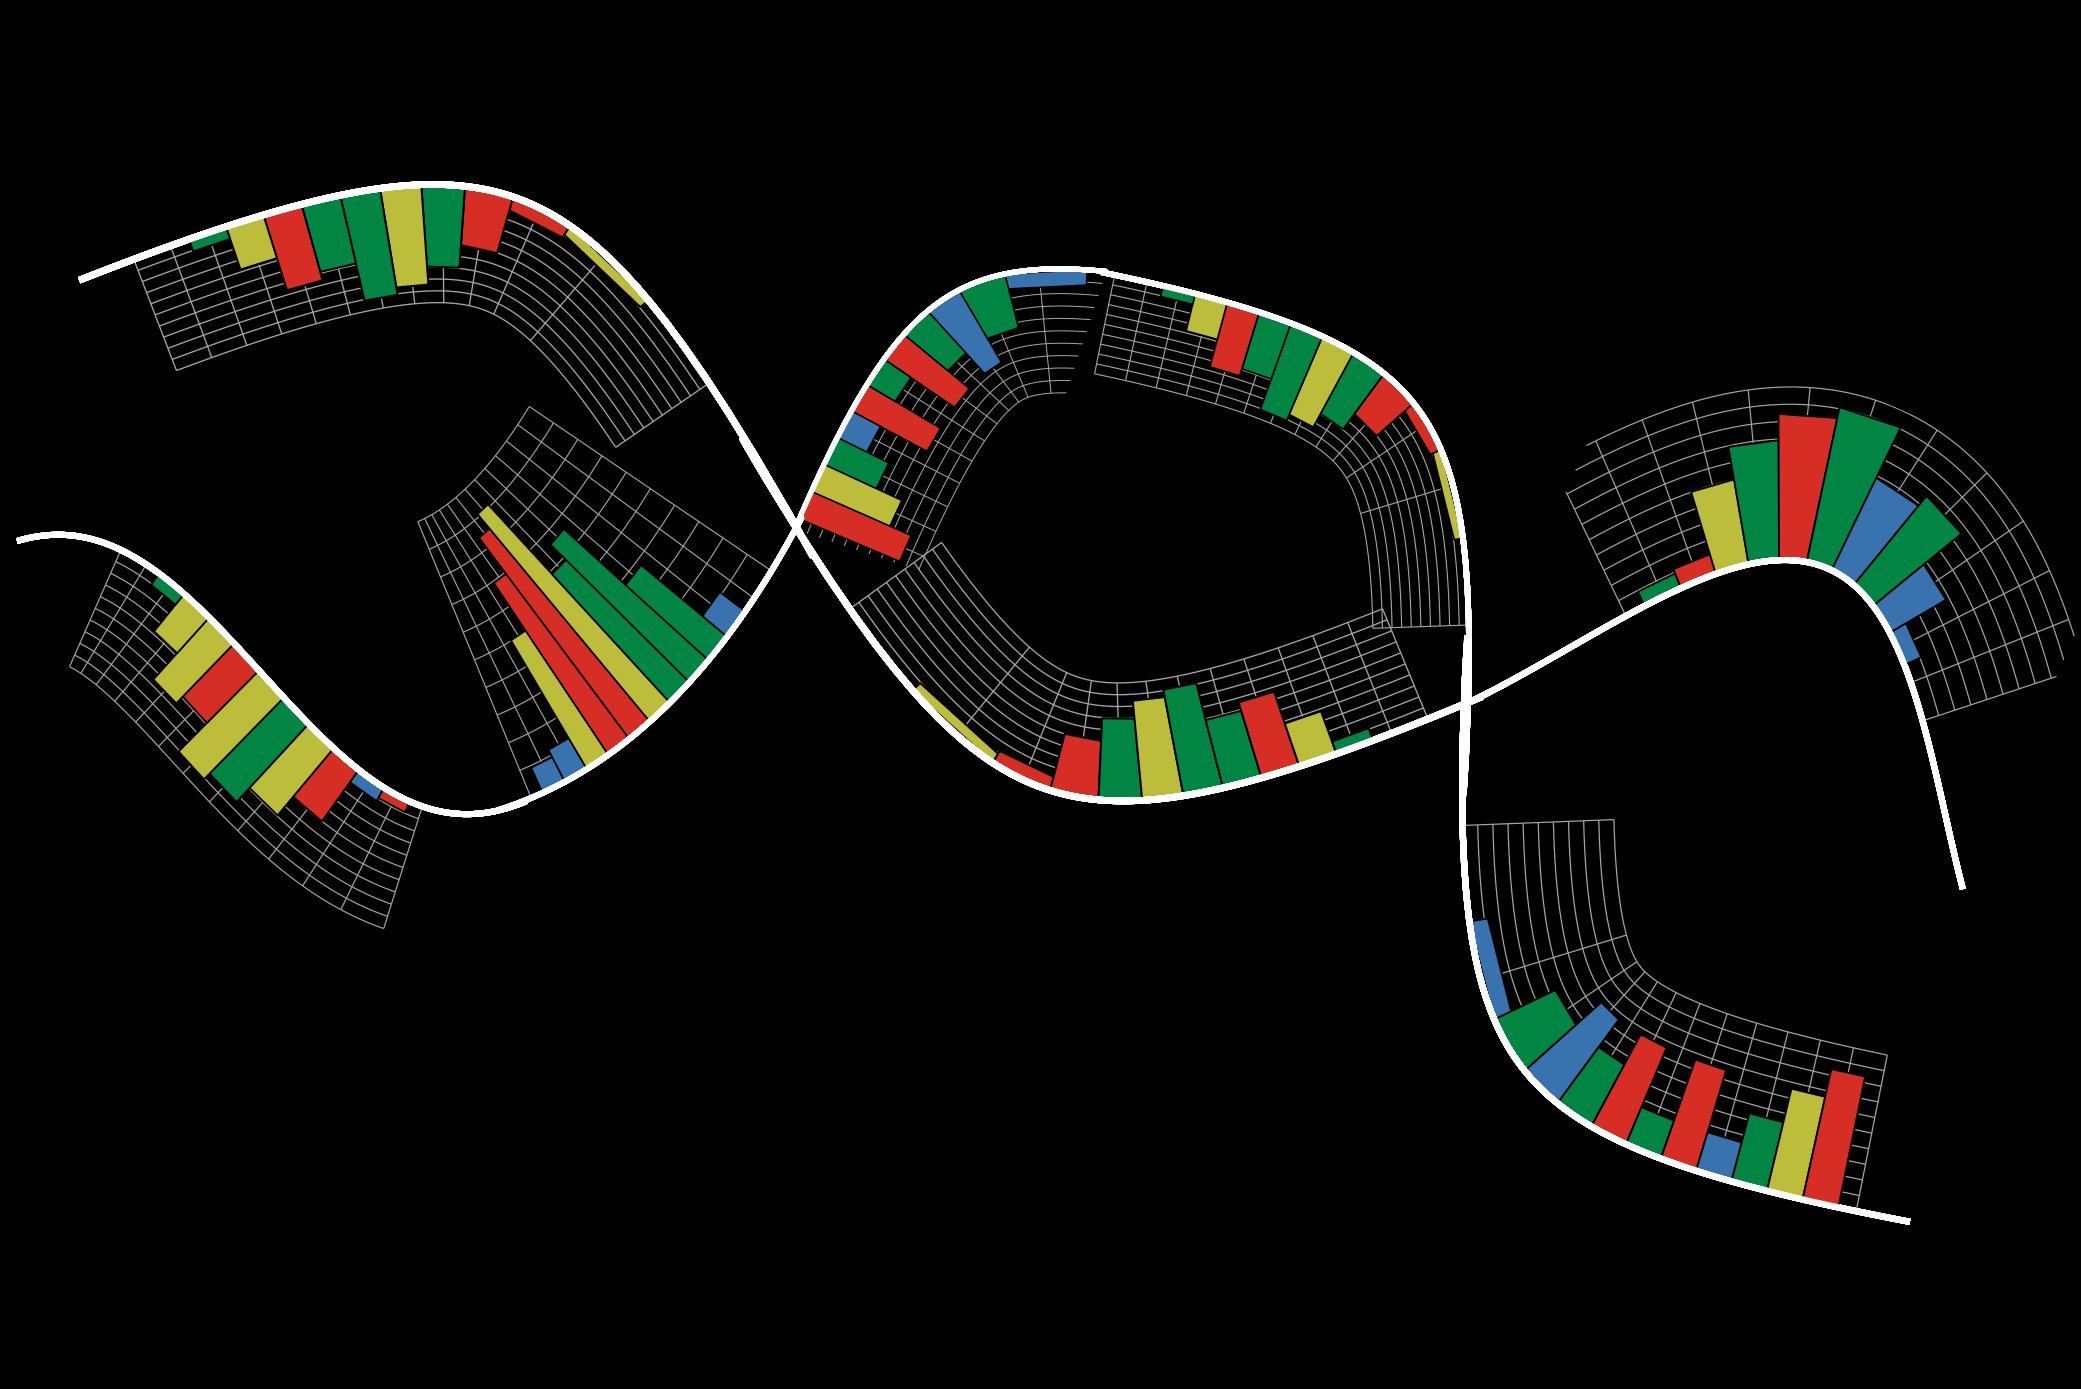
Issue 218: Have you ever wanted to visualize a histogram or density from counts of (x,y) pairs? Say if you wanted take a slice through a 2-dimensional density function along an arbitrary (non-linear) path? Look no further! Originally, the term ‘histo’ means mast, as in a sailboat mast that holds the luff of a sail. Here we call these a curvogram, which is a histogram on a curve that is given by a user defined function. To create these, orientated the bins so that they are perpendicular to the curve and performed a coordinate transform to ensure the edges are perpendicular to the curve at every point. To try this out yourself and help us develop this idea, you can find a MATLAB and Python version of our code here.